

CLSK slides around 6.5% as stock trades below all major moving averages and sellers remain in control

CleanSpark Inc. (CLSK) extended its decline by 6.60% amid a persistent lack of confirmed company events, as selling pressure intensified. The drop is reinforced by a bearish technical structure, with the stock trading below all major moving averages and sellers dominating momentum indicators.
 6.77
7.35
Highlights
- Shares of CleanSpark continue to show strong downside momentum, trading below key short-, medium-, and long-term moving averages.
- Technical indicators, including MACD, ADX, and BBP, confirm a dominant selling trend and oversold conditions for CleanSpark stock.
- CleanSpark stock is expected to consolidate between support at $6.51 and resistance at $7.79 over the next five sessions, with an over 80% probability of further decline.
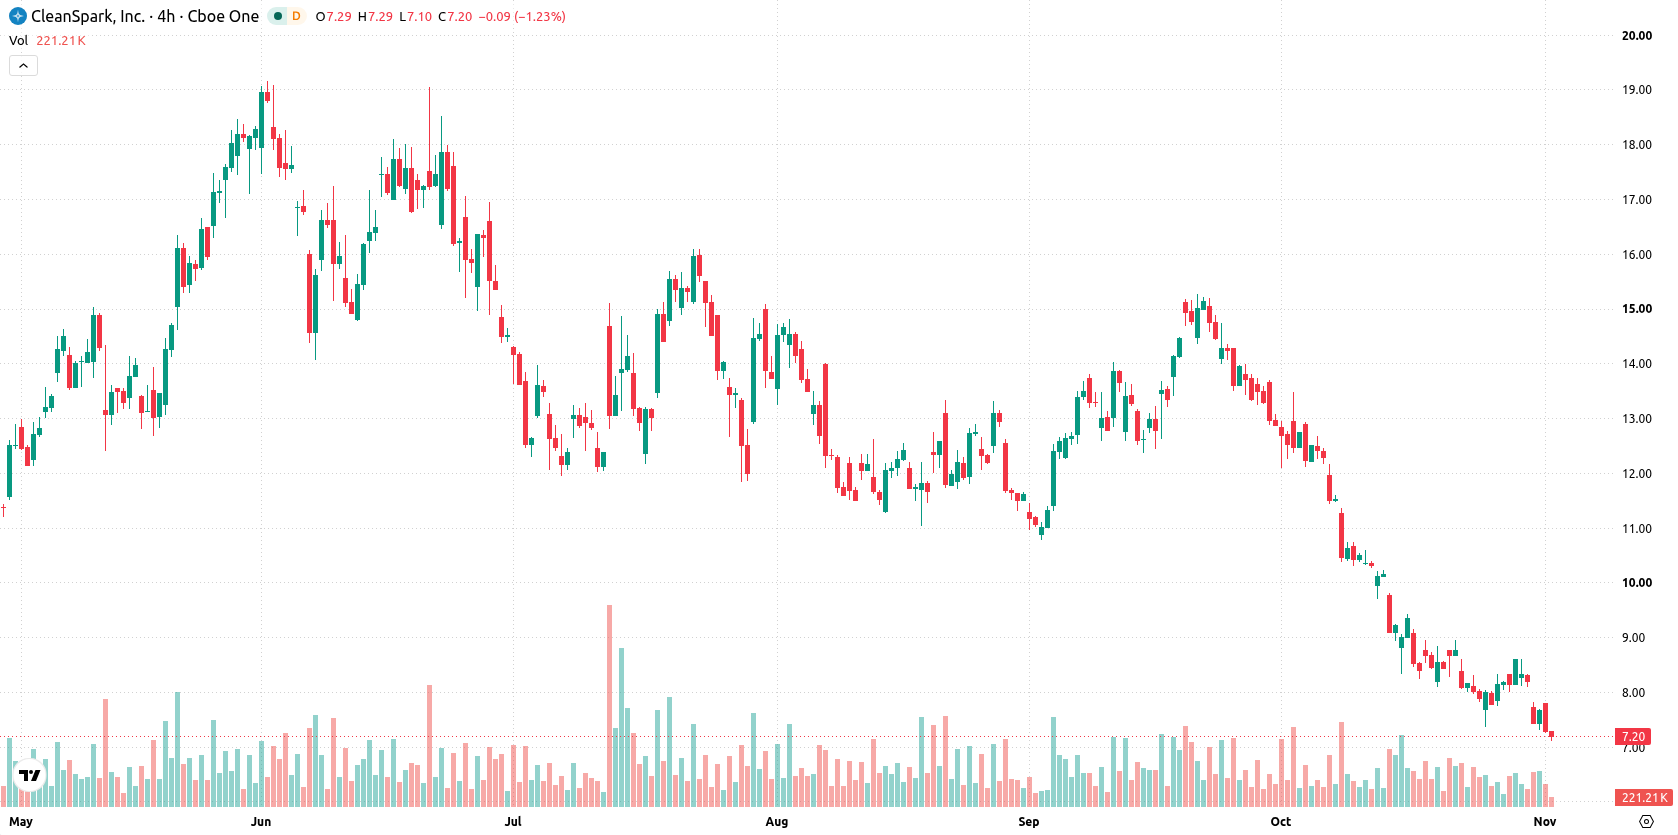
Bearish momentum confirmed as technical indicators signal seller dominance
CleanSpark is trading below the 20-day, 50-day, and 200-day moving averages at $9.35, $11.53, and $12.34, respectively, confirming short-, medium-, and long-term downside momentum. The prevailing trend remains bearish, with immediate resistance at $7.28 and support at $6.51. Momentum is weak based on the Moving Average Convergence Divergence (MACD) and a strong selling trend per the Average Directional Index (ADX), while Relative Strength Index (RSI) at 29.04 signals oversold conditions. Stochastic RSI, Commodity Channel Index (CCI), and Bull/Bear Power (BBP) confirm sellers in control, BBP reading at -0.85 indicates clear seller dominance, and the oversold bias is reinforced by BBP’s forecast. The price is trading near session lows, with volatility and intraday action reflecting sustained sell pressure consistent with momentum readings.
Earlier, analysts noted that CleanSpark was exhibiting notable technical weakness and a heightened risk of further downside. The latest analysis reinforces this bearish outlook, with traders advised to monitor $6.51 as a critical support level that could signal the potential for additional declines.






Latest CleanSpark News



-
 Afghanistan
-
 Albania
-
 Algeria
-
 Angola
-
 Argentina
-
 Armenia
-
 Australia
-
 Austria
-
 Azerbaijan
-
 Bahamas
-
 Bahrain
-
 Bangladesh
-
 Belarus
-
 Belgium
-
 Bolivia
-
 Botswana
-
 Brazil
-
 Brunei
-
 Bulgaria
-
 Cambodia
-
 Cameroon
-
 Canada
-
 Chile
-
 China
-
 Colombia
-
 Congo
-
 Costa Rica
-
 Cote d'Ivoire
-
 Croatia
-
 Cuba
-
 Cyprus
-
 Czechia
-
 DR Congo
-
 Denmark
-
 Dominican Republic
-
 Ecuador
-
 Egypt
-
 El Salvador
-
 Estonia
-
 Eswatini
-
 Ethiopia
-
 Finland
-
 France
-
 Georgia
-
 Germany
-
 Ghana
-
 Greece
-
 Haiti
-
 Hong Kong
-
 Hungary
-
 India
-
 Indonesia
-
 Iran, Islamic republic
-
 Iraq
-
 Ireland
-
 Israel
-
 Italy
-
 Jamaica
-
 Japan
-
 Jordan
-
 Kazakhstan
-
 Kenya
-
 Korea
-
 Kuwait
-
 Kyrgyzstan
-
 Laos
-
 Latvia
-
 Lebanon
-
 Lesotho
-
 Libya
-
 Lithuania
-
 Luxembourg
-
 Madagascar
-
 Malaysia
-
 Malta
-
 Mauritius
-
 Mexico
-
 Moldova
-
 Mongolia
-
 Montenegro
-
 Morocco
-
 Mozambique
-
 Myanmar
-
 Namibia
-
 Nepal
-
 Netherlands
-
 New Zealand
-
 Nigeria
-
 North Macedonia
-
 Norway
-
 Oman
-
 Pakistan
-
 Palestine
-
 Panama
-
 Papua New Guinea
-
 Paraguay
-
 Peru
-
 Philippines
-
 Poland
-
 Portugal
-
 Puerto Rico
-
 Qatar
-
 Reunion
-
 Romania
-
 Rwanda
-
 Saudi Arabia
-
 Serbia
-
 Singapore
-
 Slovakia
-
 Slovenia
-
 Somalia
-
 South Africa
-
 Spain
-
 Sri Lanka
-
 Sweden
-
 Switzerland
-
 Syria
-
 Taiwan
-
 Tajikistan
-
 Tanzania
-
 Thailand
-
 Trinidad and Tobago
-
 Tunisia
-
 Turkey
-
 UAE
-
 Uganda
-
 Ukraine
-
 United Kingdom
-
United States
-
 Uruguay
-
 Uzbekistan
-
 Venezuela
-
 Vietnam
-
 Yemen
-
 Zambia
-
 Zimbabwe
- Forex
- Crypto












