

ABT advances as upward price move supported by buyers

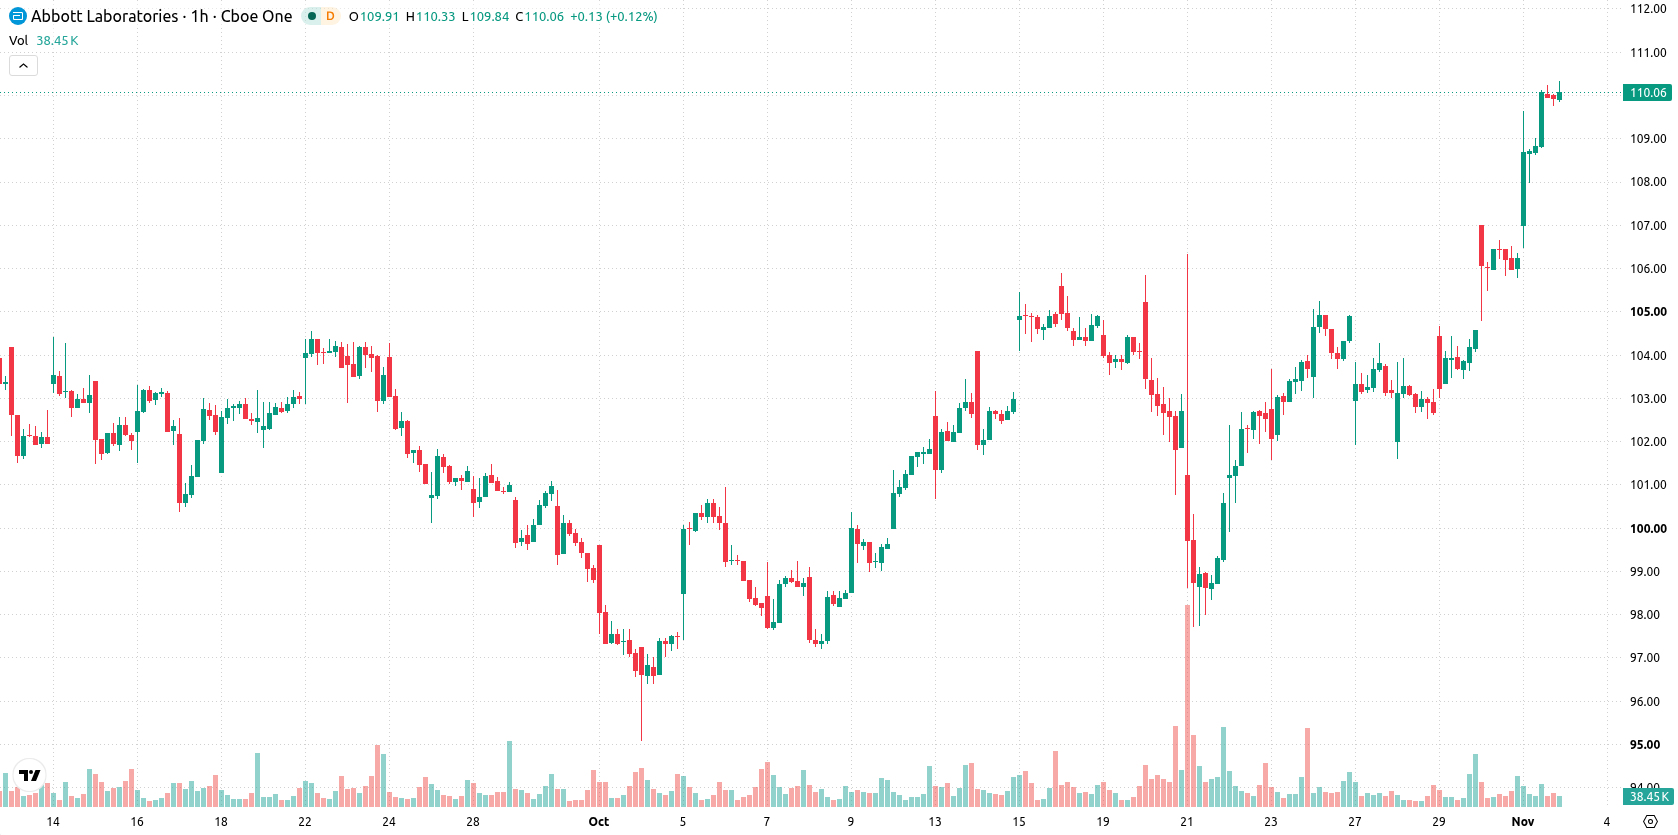
Abbott Laboratories (ABT) stock is trading at $110.28, up 3.8% for the session, and remains above its key moving averages on both short and long timeframes. The price holds near the session high with strong intraday momentum, reflecting continued buying interest amid elevated volatility.
 110.48
Highlights
- Abbott Laboratories reported positive clinical results for its SonicForce Coronary Intravascular Lithotripsy System, supporting growth in its medical device business.
- The company plans to spin off its Nutrition segment by 2027, facing potential challenges from updated FDA infant formula standards.
- Shares of Abbott Laboratories rose 3.8% to $110.28, displaying strong bullish momentum with projected trading between $108.03 to $112.53 over the next 2 to 3 days.
Clinical trial success and spinoff plans drive renewed buying interest
Abbott Laboratories reported positive clinical trial results for its SonicForce Coronary Intravascular Lithotripsy System in the TECTONIC study, demonstrating safety and effectiveness for treating severe coronary calcification, according to Simplywall. This outcome underscores the company's strength in medical device innovation and elevates growth prospects in a key segment, fueling renewed buying interest. Additional support comes from the company’s announcement of a planned spinoff of its Nutrition segment by 2027, as reported by TradingKey, though this move faces added complexity from the FDA’s first infant formula standards update in 30 years, noted by Chicagobusiness, which could pose new regulatory hurdles for the nutrition unit’s separation.
Multiple buy signals as price clears key averages despite mixed oscillators
On the technical front, price is trading above the MA-20 at $104.42 and MA-50 at $103.68 on the hourly chart, and remains above the MA-200 at $101.7 on the daily timeframe. Immediate support is marked by the Ichimoku Kijun at $104.22. Momentum indicators show MACD and ADX both on Buy, while RSI is elevated at 69.27 with a Buy signal. CCI confirms a Buy signal, and Bull/Bear Power indicates strong buyer dominance combined with overbought pressure. Stoch RSI is Neutral and AO is also Neutral, leading to some divergence among oscillators, with Stoch RSI and AO not fully confirming the prevailing upward trend.
Sideways consolidation likely as upside potential outpaces downside risk
Over the next two to three trading days, price is expected to remain within a volatility band of $108.03 to $112.53. The probability of further upside is assessed as very high, while downside risk appears very limited. The baseline scenario anticipates sideways consolidation within this projected range, with a bullish move potentially emerging if price breaks above resistance, or a bearish scenario developing only if price falls below the immediate support zone.
Earlier, analysts noted that Abbott shares were constrained by consolidative price action with downside risk predominating. The latest technical picture now signals a shift toward a bullish bias as prices trade decisively above major moving averages, making the breakout above immediate resistance a key level to watch for confirmation of further upside momentum.









-
 Afghanistan
-
 Albania
-
 Algeria
-
 Angola
-
 Argentina
-
 Armenia
-
 Australia
-
 Austria
-
 Azerbaijan
-
 Bahamas
-
 Bahrain
-
 Bangladesh
-
 Belarus
-
 Belgium
-
 Bolivia
-
 Botswana
-
 Brazil
-
 Brunei
-
 Bulgaria
-
 Cambodia
-
 Cameroon
-
 Canada
-
 Chile
-
 China
-
 Colombia
-
 Congo
-
 Costa Rica
-
 Cote d'Ivoire
-
 Croatia
-
 Cuba
-
 Cyprus
-
 Czechia
-
 DR Congo
-
 Denmark
-
 Dominican Republic
-
 Ecuador
-
 Egypt
-
 El Salvador
-
 Estonia
-
 Eswatini
-
 Ethiopia
-
 Finland
-
 France
-
 Georgia
-
 Germany
-
 Ghana
-
 Greece
-
 Haiti
-
 Hong Kong
-
 Hungary
-
 India
-
 Indonesia
-
 Iran, Islamic republic
-
 Iraq
-
 Ireland
-
 Israel
-
 Italy
-
 Jamaica
-
 Japan
-
 Jordan
-
 Kazakhstan
-
 Kenya
-
 Korea
-
 Kuwait
-
 Kyrgyzstan
-
 Laos
-
 Latvia
-
 Lebanon
-
 Lesotho
-
 Libya
-
 Lithuania
-
 Luxembourg
-
 Madagascar
-
 Malaysia
-
 Malta
-
 Mauritius
-
 Mexico
-
 Moldova
-
 Mongolia
-
 Montenegro
-
 Morocco
-
 Mozambique
-
 Myanmar
-
 Namibia
-
 Nepal
-
 Netherlands
-
 New Zealand
-
 Nigeria
-
 North Macedonia
-
 Norway
-
 Oman
-
 Pakistan
-
 Palestine
-
 Panama
-
 Papua New Guinea
-
 Paraguay
-
 Peru
-
 Philippines
-
 Poland
-
 Portugal
-
 Puerto Rico
-
 Qatar
-
 Reunion
-
 Romania
-
 Rwanda
-
 Saudi Arabia
-
 Serbia
-
 Singapore
-
 Slovakia
-
 Slovenia
-
 Somalia
-
 South Africa
-
 Spain
-
 Sri Lanka
-
 Sweden
-
 Switzerland
-
 Syria
-
 Taiwan
-
 Tajikistan
-
 Tanzania
-
 Thailand
-
 Trinidad and Tobago
-
 Tunisia
-
 Turkey
-
 UAE
-
 Uganda
-
 Ukraine
-
 United Kingdom
-
United States
-
 Uruguay
-
 Uzbekistan
-
 Venezuela
-
 Vietnam
-
 Yemen
-
 Zambia
-
 Zimbabwe
- Forex
- Crypto












