

American Express stock weekly forecast: Momentum persists with MACD buy signal even as upside narrows

Shares of American Express Company (AXP) are trading near $326 after a nearly 2% rise over the past week, as investors responded to signs of ongoing growth and new business developments. With the rally now running into overbought conditions, attention turns to whether momentum can persist or cool in the coming days.
 337.22
Highlights
- Shares of American Express rose 2% over the past week to $326.06, holding at long-term support.
- Technical indicators are mixed, with some overbought signals and neutral momentum, suggesting possible consolidation or correction risk.
- Shares are expected to trade in a narrow range of $318.82 to $333.29, with support at $325.93 and resistance at $329.97.
Earnings beat and restructuring steer sentiment amid new partnership announcements
American Express reported higher third-quarter 2026 net income of $3.71 billion and raised its full-year earnings guidance, while keeping revenue growth expectations unchanged, according to Yahoo Finance. The company also launched new card partnerships with Airbnb and Albertsons, and announced a plan to cut roughly 5% of its global workforce with a $336 million pre-tax restructuring charge. Additionally, American Express expanded its global partnership with the NBA and WNBA to include international markets.
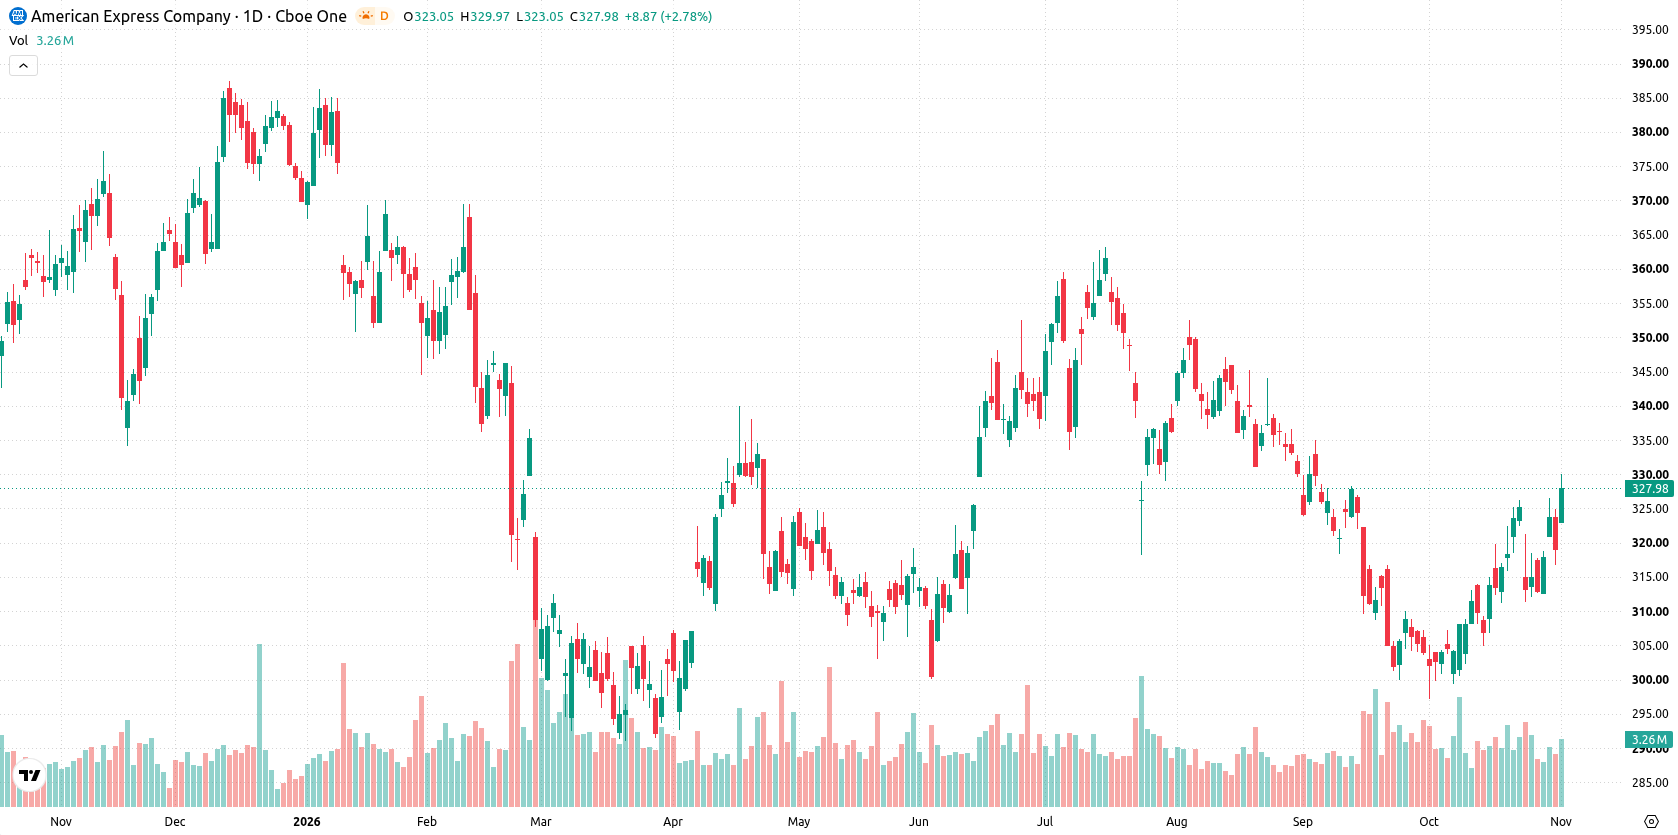
Mixed oscillators and flat structure challenge upside as price stays at MA-200
On the daily chart, structure is flat with American Express sitting at the MA-200 and volatility registering at 5.15% over the past week. Oscillator signals are mixed: CCI and Stochastic RSI are overbought, highlighting possible overheating and correction risk, while RSI stays neutral at 61.41. The MACD remains on a buy signal, suggesting upward momentum persists, but this is balanced against overbought pressures from other oscillators. Support rests at $325.93 (MA-200), with resistance at $329.97, and the Ichimoku Kijun at $313.25 offers an additional practical support zone.
Consolidation favored next week unless resistance or support levels break
In the week ahead, the expected range stands at $318.82 to $333.29. Probabilities favor an increase (74% upside versus 26% downside), with a contained move within a narrow range likely. The base case is consolidation between support at $325.93 and resistance at $329.97. A break above $329.97 would open the path toward the top of the expected range, while a move below $325.93 may trigger a deeper pullback toward $318.82.
Previously it was reported that American Express introduced new direct deposit options for cash back rewards, reflecting ongoing efforts to enhance its credit services and cardholder benefits. With the company now reporting stronger earnings, announcing new partnerships, and implementing cost-cutting measures amid technical overbought signals, traders should closely watch $329.97 as the key resistance level for any potential breakout in the near term.






Latest American Express News




-
 Afghanistan
-
 Albania
-
 Algeria
-
 Angola
-
 Argentina
-
 Armenia
-
 Australia
-
 Austria
-
 Azerbaijan
-
 Bahamas
-
 Bahrain
-
 Bangladesh
-
 Belarus
-
 Belgium
-
 Bolivia
-
 Botswana
-
 Brazil
-
 Brunei
-
 Bulgaria
-
 Cambodia
-
 Cameroon
-
 Canada
-
 Chile
-
 China
-
 Colombia
-
 Congo
-
 Costa Rica
-
 Cote d'Ivoire
-
 Croatia
-
 Cuba
-
 Cyprus
-
 Czechia
-
 DR Congo
-
 Denmark
-
 Dominican Republic
-
 Ecuador
-
 Egypt
-
 El Salvador
-
 Estonia
-
 Eswatini
-
 Ethiopia
-
 Finland
-
 France
-
 Georgia
-
 Germany
-
 Ghana
-
 Greece
-
 Haiti
-
 Hong Kong
-
 Hungary
-
 India
-
 Indonesia
-
 Iran, Islamic republic
-
 Iraq
-
 Ireland
-
 Israel
-
 Italy
-
 Jamaica
-
 Japan
-
 Jordan
-
 Kazakhstan
-
 Kenya
-
 Korea
-
 Kuwait
-
 Kyrgyzstan
-
 Laos
-
 Latvia
-
 Lebanon
-
 Lesotho
-
 Libya
-
 Lithuania
-
 Luxembourg
-
 Madagascar
-
 Malaysia
-
 Malta
-
 Mauritius
-
 Mexico
-
 Moldova
-
 Mongolia
-
 Montenegro
-
 Morocco
-
 Mozambique
-
 Myanmar
-
 Namibia
-
 Nepal
-
 Netherlands
-
 New Zealand
-
 Nigeria
-
 North Macedonia
-
 Norway
-
 Oman
-
 Pakistan
-
 Palestine
-
 Panama
-
 Papua New Guinea
-
 Paraguay
-
 Peru
-
 Philippines
-
 Poland
-
 Portugal
-
 Puerto Rico
-
 Qatar
-
 Reunion
-
 Romania
-
 Rwanda
-
 Saudi Arabia
-
 Serbia
-
 Singapore
-
 Slovakia
-
 Slovenia
-
 Somalia
-
 South Africa
-
 Spain
-
 Sri Lanka
-
 Sweden
-
 Switzerland
-
 Syria
-
 Taiwan
-
 Tajikistan
-
 Tanzania
-
 Thailand
-
 Trinidad and Tobago
-
 Tunisia
-
 Turkey
-
 UAE
-
 Uganda
-
 Ukraine
-
 United Kingdom
-
United States
-
 Uruguay
-
 Uzbekistan
-
 Venezuela
-
 Vietnam
-
 Yemen
-
 Zambia
-
 Zimbabwe
- Forex
- Crypto












