

Texas Instruments insider purchase and ETF demand: Can TXN sustain gains?

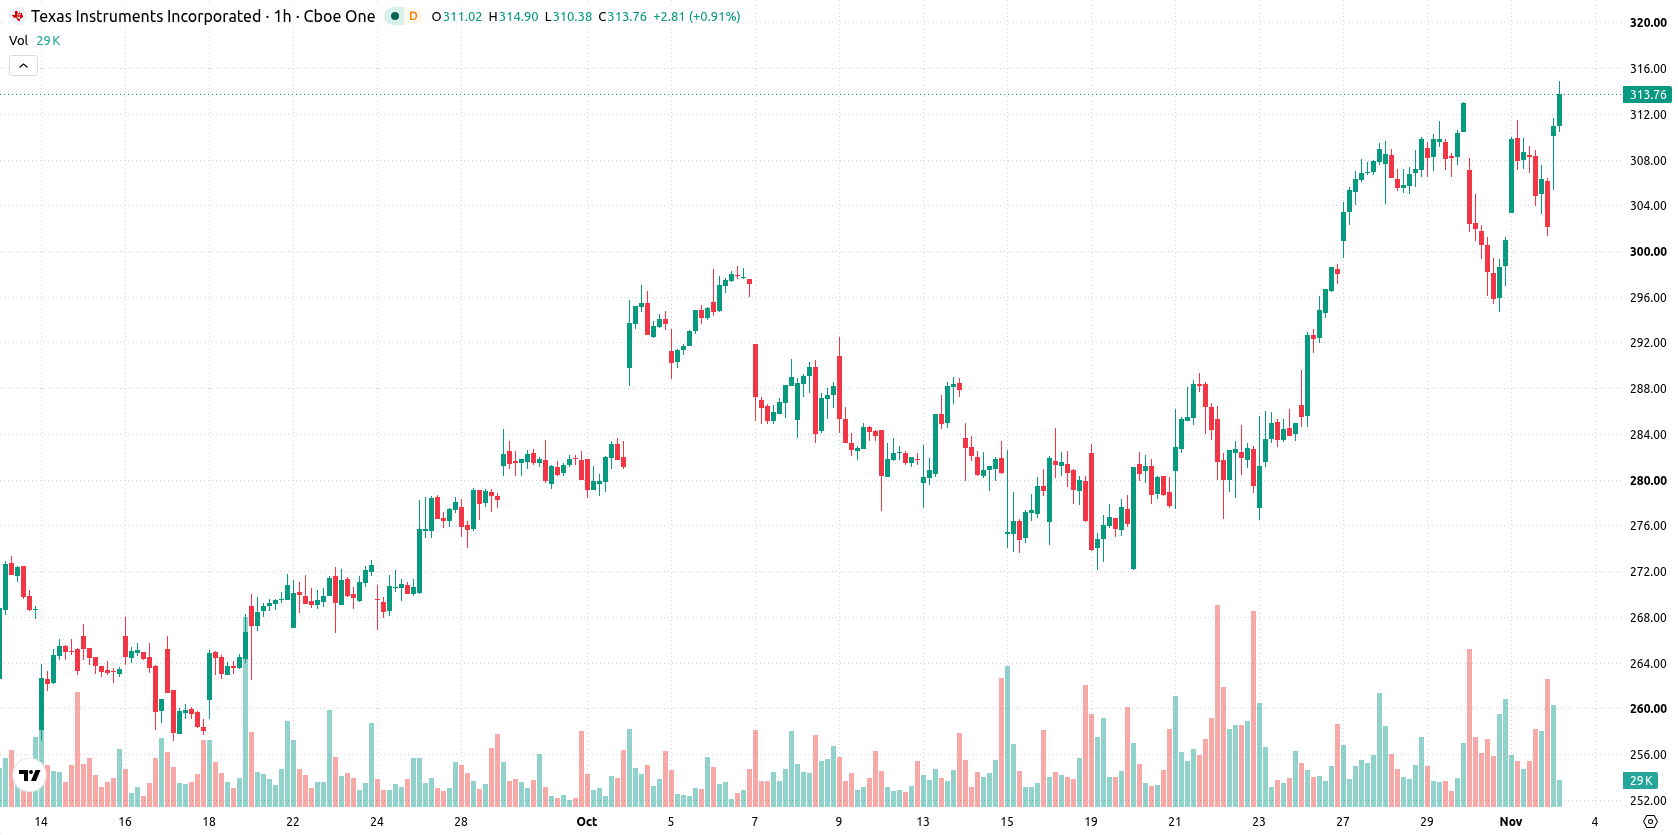
Texas Instruments (TXN) stock is trading at $315.35, up 4.41% on the day and sitting close to its daily high. The price remains above its key moving averages, reflecting continued strength in the prevailing trend.
 280.51
316.78
Highlights
- Representative Thomas H. Kean, Jr. purchased $1,001 to $15,000 of Texas Instruments stock on September 17, 2026.
- ETFs acquired $114.8 million of Texas Instruments stock across 47 funds in the third quarter of 2026, while 23 funds sold.
- Texas Instruments stock displays strong bullish momentum with a forecast range of $304.73 to $323.47, but overbought conditions indicate short-term pullback risk.
Insider buying and ETF inflows fuel investor confidence
On September 17, 2026, Representative Thomas H. Kean, Jr. (Republican-New Jersey) purchased between $1,001 and $15,000 of Texas Instruments stock, an insider move that may help catalyze market attention and support buyer momentum, according to MarketBeat. Such purchases by public figures can strengthen confidence in the stock, potentially encouraging further inflows from other investors. In addition, ETFs contributed to the rising demand in the third quarter of 2026, with $114.8 million of Texas Instruments stock acquired across 47 funds while 23 funds sold, based on data from Yahoo Finance.
Support holds amid bullish momentum but short-term overheating risk
The $303.89 Ichimoku Kijun level acts as immediate support for TXN, providing a reference point for traders monitoring downside risk. On the hourly timeframe, the asset remains above both the MA-20 and MA-50, while the daily chart shows it holding well above the MA-200. MACD and ADX are both in bullish alignment, reflecting ongoing positive momentum. Oscillator signals are mixed: RSI and CCI are neutral, Stochastic RSI is overbought and signals potential short-term overheating, and Bull/Bear Power is strongly positive at 5.44, emphasizing intraday buyer dominance.
Range-bound outlook with breakout scenarios driving direction
Over the next few sessions, TXN is expected to trade in a range between $304.73 and $323.47, in line with typical volatility. The baseline scenario is for sideways movement within this band. A break above the $323.47 resistance could trigger a further rally, while a move below the $304.73 support would bring short-term correction risk into play.
Previously it was reported that Texas Instruments faced short-term technical weakness despite a constructive long-term outlook supported by dividend increases. The latest developments highlight a shift to sustained bullish momentum, with insider buying and strong ETF inflows further reinforcing the current trend, making the $323.47 resistance level important for assessing potential upside continuation.






Latest Texas Instruments News




-
 Afghanistan
-
 Albania
-
 Algeria
-
 Angola
-
 Argentina
-
 Armenia
-
 Australia
-
 Austria
-
 Azerbaijan
-
 Bahamas
-
 Bahrain
-
 Bangladesh
-
 Belarus
-
 Belgium
-
 Bolivia
-
 Botswana
-
 Brazil
-
 Brunei
-
 Bulgaria
-
 Cambodia
-
 Cameroon
-
 Canada
-
 Chile
-
 China
-
 Colombia
-
 Congo
-
 Costa Rica
-
 Cote d'Ivoire
-
 Croatia
-
 Cuba
-
 Cyprus
-
 Czechia
-
 DR Congo
-
 Denmark
-
 Dominican Republic
-
 Ecuador
-
 Egypt
-
 El Salvador
-
 Estonia
-
 Eswatini
-
 Ethiopia
-
 Finland
-
 France
-
 Georgia
-
 Germany
-
 Ghana
-
 Greece
-
 Haiti
-
 Hong Kong
-
 Hungary
-
 India
-
 Indonesia
-
 Iran, Islamic republic
-
 Iraq
-
 Ireland
-
 Israel
-
 Italy
-
 Jamaica
-
 Japan
-
 Jordan
-
 Kazakhstan
-
 Kenya
-
 Korea
-
 Kuwait
-
 Kyrgyzstan
-
 Laos
-
 Latvia
-
 Lebanon
-
 Lesotho
-
 Libya
-
 Lithuania
-
 Luxembourg
-
 Madagascar
-
 Malaysia
-
 Malta
-
 Mauritius
-
 Mexico
-
 Moldova
-
 Mongolia
-
 Montenegro
-
 Morocco
-
 Mozambique
-
 Myanmar
-
 Namibia
-
 Nepal
-
 Netherlands
-
 New Zealand
-
 Nigeria
-
 North Macedonia
-
 Norway
-
 Oman
-
 Pakistan
-
 Palestine
-
 Panama
-
 Papua New Guinea
-
 Paraguay
-
 Peru
-
 Philippines
-
 Poland
-
 Portugal
-
 Puerto Rico
-
 Qatar
-
 Reunion
-
 Romania
-
 Rwanda
-
 Saudi Arabia
-
 Serbia
-
 Singapore
-
 Slovakia
-
 Slovenia
-
 Somalia
-
 South Africa
-
 Spain
-
 Sri Lanka
-
 Sweden
-
 Switzerland
-
 Syria
-
 Taiwan
-
 Tajikistan
-
 Tanzania
-
 Thailand
-
 Trinidad and Tobago
-
 Tunisia
-
 Turkey
-
 UAE
-
 Uganda
-
 Ukraine
-
 United Kingdom
-
United States
-
 Uruguay
-
 Uzbekistan
-
 Venezuela
-
 Vietnam
-
 Yemen
-
 Zambia
-
 Zimbabwe
- Forex
- Crypto












