

Meta Platforms shares technical analysis: Upward move faces resistance at $633.98

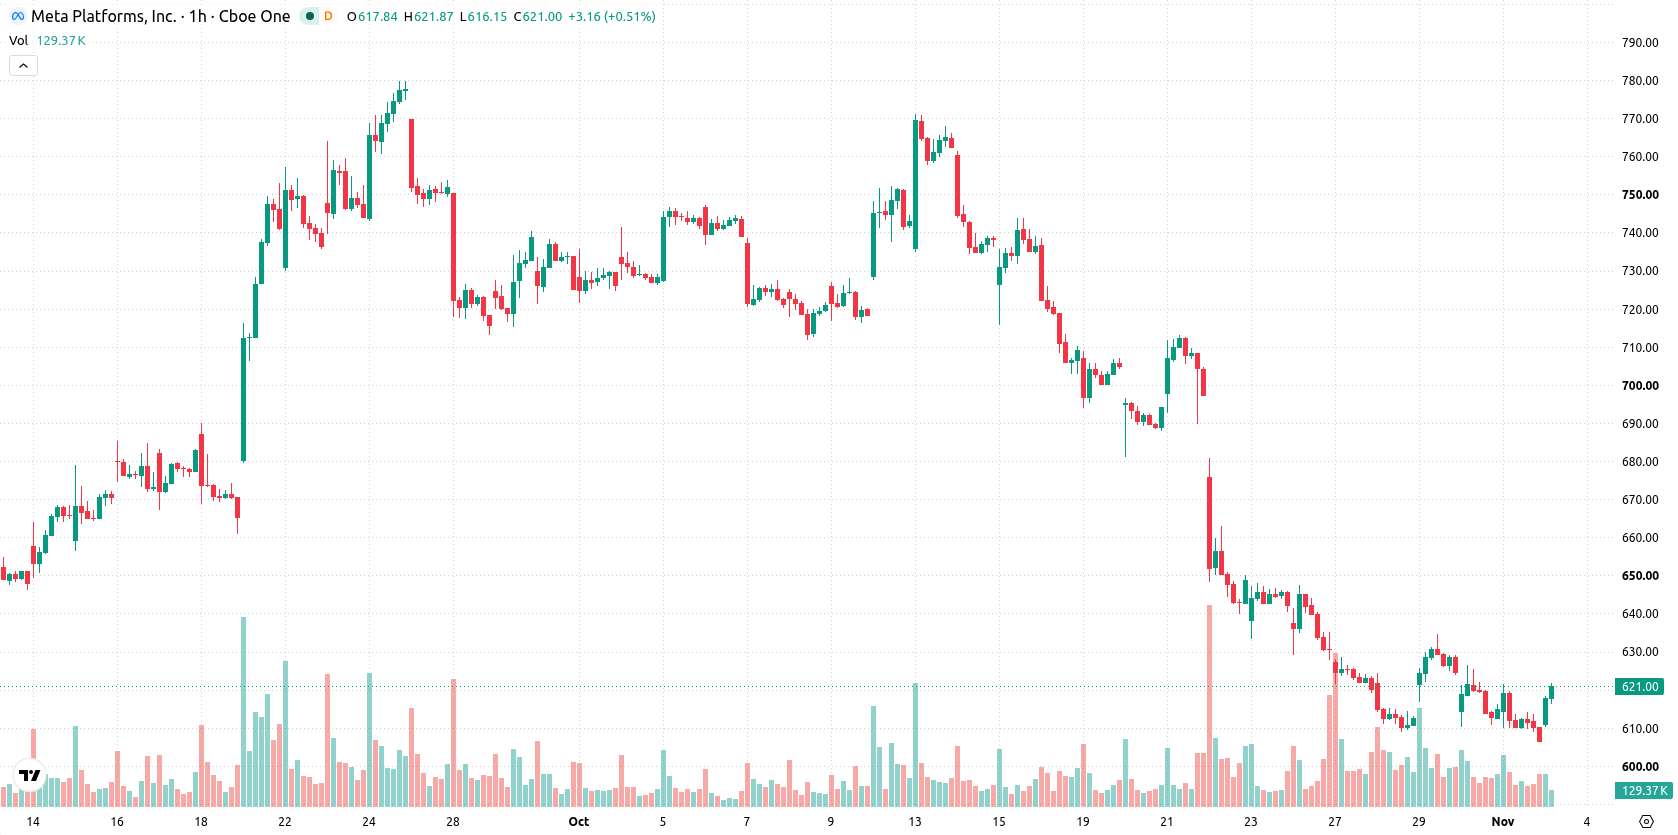
Meta Platforms (META) stock is trading at $621.37 after gaining 2.44% on the day. The price is positioned above its short-term moving averages but faces medium- and long-term resistance.
 624.84
634.66
Highlights
- Meta Platforms is raising at least $20 billion through U.S. dollar and euro bonds to fund artificial intelligence infrastructure.
- S&P Global Ratings assigned a negative credit outlook to Meta citing increasing leverage and persistent capital expenditures.
- Shares of Meta gained 2.44% to $621.37 but face bearish medium-term technical signals and an expected price range of $608.76 to $633.98.
Aggressive debt issuance as AI spending and leverage concerns rise
Meta Platforms has launched a major debt offering targeting at least $20 billion across U.S. dollar and euro bonds to fund its artificial intelligence infrastructure buildout, according to Gurufocus. This capital raise is expected to provide the company with greater liquidity and flexibility to accelerate AI investment, directly supporting growth initiatives and attracting investor demand. Bloomberg noted that approximately $15 billion of the total will be raised from the U.S. dollar portion, underscoring the scale of Meta's funding efforts; however, S&P Global Ratings downgraded the company's credit outlook to negative on November 2, 2026, reflecting concerns about rising leverage and ongoing capital spending.
Mixed momentum as sellers dominate within defined support-resistance range
META is currently trading above its MA-20, while still below the MA-50 and MA-200. The Ichimoku Kijun at $620.57 acts as the nearest support. Overhead resistance and immediate support define the short-term trading corridor. Technical indicators are mixed: MACD and ADX both remain bearish, whereas RSI sits in a neutral range. Stoch RSI and CCI are in oversold territory, pointing to ongoing selling pressure but possible exhaustion. Bull/Bear Power signals intraday seller dominance, and the Awesome Oscillator is not confirming upward momentum.
Slight downside bias as support teeters amid volatile outlook
Looking ahead, META is expected to fluctuate between $608.76 and $633.98 over the next several days, reflecting typical volatility for the period. There is a 43% probability of an upward move and a 57% chance of a downward move, suggesting a slightly higher risk of short-term weakness unless support at $608.76 is sustained. A move above the upper boundary at $633.98 would signal bullish momentum, while a breakdown through support could prompt further declines.
Earlier, analysts noted that Meta Platforms faced persistent downside pressures driven by rising expenses and technical weakness. The current analysis adds weight to those concerns, highlighting the importance of the $608.76 support level as a critical threshold for short-term price direction in the wake of the company's large-scale debt issuance.











-
 Afghanistan
-
 Albania
-
 Algeria
-
 Angola
-
 Argentina
-
 Armenia
-
 Australia
-
 Austria
-
 Azerbaijan
-
 Bahamas
-
 Bahrain
-
 Bangladesh
-
 Belarus
-
 Belgium
-
 Bolivia
-
 Botswana
-
 Brazil
-
 Brunei
-
 Bulgaria
-
 Cambodia
-
 Cameroon
-
 Canada
-
 Chile
-
 China
-
 Colombia
-
 Congo
-
 Costa Rica
-
 Cote d'Ivoire
-
 Croatia
-
 Cuba
-
 Cyprus
-
 Czechia
-
 DR Congo
-
 Denmark
-
 Dominican Republic
-
 Ecuador
-
 Egypt
-
 El Salvador
-
 Estonia
-
 Eswatini
-
 Ethiopia
-
 Finland
-
 France
-
 Georgia
-
 Germany
-
 Ghana
-
 Greece
-
 Haiti
-
 Hong Kong
-
 Hungary
-
 India
-
 Indonesia
-
 Iran, Islamic republic
-
 Iraq
-
 Ireland
-
 Israel
-
 Italy
-
 Jamaica
-
 Japan
-
 Jordan
-
 Kazakhstan
-
 Kenya
-
 Korea
-
 Kuwait
-
 Kyrgyzstan
-
 Laos
-
 Latvia
-
 Lebanon
-
 Lesotho
-
 Libya
-
 Lithuania
-
 Luxembourg
-
 Madagascar
-
 Malaysia
-
 Malta
-
 Mauritius
-
 Mexico
-
 Moldova
-
 Mongolia
-
 Montenegro
-
 Morocco
-
 Mozambique
-
 Myanmar
-
 Namibia
-
 Nepal
-
 Netherlands
-
 New Zealand
-
 Nigeria
-
 North Macedonia
-
 Norway
-
 Oman
-
 Pakistan
-
 Palestine
-
 Panama
-
 Papua New Guinea
-
 Paraguay
-
 Peru
-
 Philippines
-
 Poland
-
 Portugal
-
 Puerto Rico
-
 Qatar
-
 Reunion
-
 Romania
-
 Rwanda
-
 Saudi Arabia
-
 Serbia
-
 Singapore
-
 Slovakia
-
 Slovenia
-
 Somalia
-
 South Africa
-
 Spain
-
 Sri Lanka
-
 Sweden
-
 Switzerland
-
 Syria
-
 Taiwan
-
 Tajikistan
-
 Tanzania
-
 Thailand
-
 Trinidad and Tobago
-
 Tunisia
-
 Turkey
-
 UAE
-
 Uganda
-
 Ukraine
-
 United Kingdom
-
United States
-
 Uruguay
-
 Uzbekistan
-
 Venezuela
-
 Vietnam
-
 Yemen
-
 Zambia
-
 Zimbabwe
- Forex
- Crypto












