


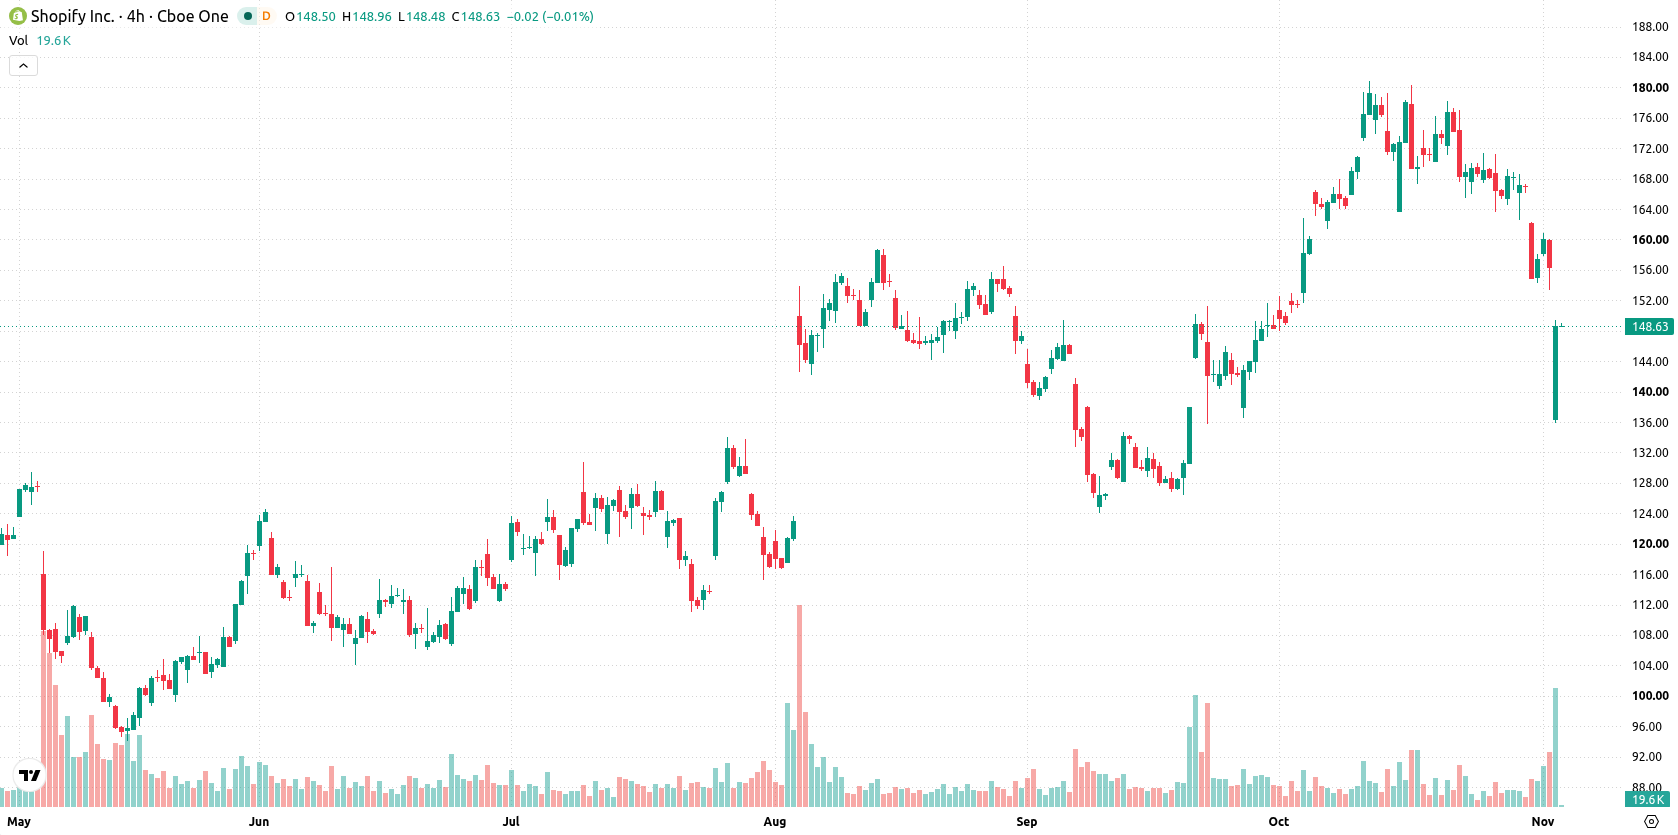
Shopify Inc. (SHOP) fell 5.31% after its Q3 2026 earnings report showed missed growth metrics for both revenue and gross merchandise volume. The move is supported by persistent selling pressure with shares remaining below the 20-day and 50-day moving averages, despite longer-term technical signals holding bullish structure.
 151.38
160.86
Highlights
- Shopify reported Q3 2026 revenue growth of 32% with adjusted earnings exceeding expectations and operating income up 66% year over year.
- Free cash flow margin reached 22%, but both revenue and gross merchandise volume fell short of some Wall Street estimates.
- Shopify stock remains under short-term and medium-term selling pressure, with technical indicators suggesting oscillators are oversold and the next 5 days expected to trade between $140.15 and $155.44.
Growth metrics miss as strong cash flow meets persistent pressure
Shopify released its Q3 2026 earnings, with revenue matching analysts' expectations but missing some Wall Street estimates as did gross merchandise volume. The company reported an adjusted earnings beat and strong free cash flow, and operating income increased 66% year-over-year. Shopify recorded 32% revenue growth alongside a 22% free cash flow margin, though price action has remained under broader selling pressure.
Sellers dominate momentum as oversold signals hint at exhaustion
Shopify is trading below its 20-day and 50-day moving averages at $168.94 and $152.88, but remains above the 200-day at $129.86. This signals persistent short- and medium-term pressure from sellers, with ongoing confirmation of a longer-term bullish bias. The near-term ceiling is set at $152.88, and the near-term floor at $140.15. Momentum indicators show mixed signals: the MACD signals strong buy, but the Average Directional Index (ADX) is neutral. The Relative Strength Index (RSI) is neutral. Both the Stochastic RSI and Commodity Channel Index (CCI) are in oversold zones, which suggests potential for an upside rebound but not a confirmed reversal. Bull/Bear Power (BBP) indicates sellers dominate intraday momentum. Shopify closed at $147.79, down $8.28 or 5.31% after an upside gap of $2.76 at the open, and traded near the low of its daily range. Intraday volatility stood at 4.79%, with pressure persisting after the open. Oscillator extremes suggest selling exhaustion, but the day’s performance still aligns with downside momentum.
Earlier, analysts noted that India’s engineering sector faced ongoing industry headwinds but saw certain companies offsetting pressures through operational strength and segment growth. While Shopify's latest results underscore continued selling pressure in the near term, the convergence of oversold technical signals highlights $140.15 as a critical downside level to monitor for signs of stabilization or further risk.






Latest Shopify News




-
 Afghanistan
-
 Albania
-
 Algeria
-
 Angola
-
 Argentina
-
 Armenia
-
 Australia
-
 Austria
-
 Azerbaijan
-
 Bahamas
-
 Bahrain
-
 Bangladesh
-
 Belarus
-
 Belgium
-
 Bolivia
-
 Botswana
-
 Brazil
-
 Brunei
-
 Bulgaria
-
 Cambodia
-
 Cameroon
-
 Canada
-
 Chile
-
 China
-
 Colombia
-
 Congo
-
 Costa Rica
-
 Cote d'Ivoire
-
 Croatia
-
 Cuba
-
 Cyprus
-
 Czechia
-
 DR Congo
-
 Denmark
-
 Dominican Republic
-
 Ecuador
-
 Egypt
-
 El Salvador
-
 Estonia
-
 Eswatini
-
 Ethiopia
-
 Finland
-
 France
-
 Georgia
-
 Germany
-
 Ghana
-
 Greece
-
 Haiti
-
 Hong Kong
-
 Hungary
-
 India
-
 Indonesia
-
 Iran, Islamic republic
-
 Iraq
-
 Ireland
-
 Israel
-
 Italy
-
 Jamaica
-
 Japan
-
 Jordan
-
 Kazakhstan
-
 Kenya
-
 Korea
-
 Kuwait
-
 Kyrgyzstan
-
 Laos
-
 Latvia
-
 Lebanon
-
 Lesotho
-
 Libya
-
 Lithuania
-
 Luxembourg
-
 Madagascar
-
 Malaysia
-
 Malta
-
 Mauritius
-
 Mexico
-
 Moldova
-
 Mongolia
-
 Montenegro
-
 Morocco
-
 Mozambique
-
 Myanmar
-
 Namibia
-
 Nepal
-
 Netherlands
-
 New Zealand
-
 Nigeria
-
 North Macedonia
-
 Norway
-
 Oman
-
 Pakistan
-
 Palestine
-
 Panama
-
 Papua New Guinea
-
 Paraguay
-
 Peru
-
 Philippines
-
 Poland
-
 Portugal
-
 Puerto Rico
-
 Qatar
-
 Reunion
-
 Romania
-
 Rwanda
-
 Saudi Arabia
-
 Serbia
-
 Singapore
-
 Slovakia
-
 Slovenia
-
 Somalia
-
 South Africa
-
 Spain
-
 Sri Lanka
-
 Sweden
-
 Switzerland
-
 Syria
-
 Taiwan
-
 Tajikistan
-
 Tanzania
-
 Thailand
-
 Trinidad and Tobago
-
 Tunisia
-
 Turkey
-
 UAE
-
 Uganda
-
 Ukraine
-
 United Kingdom
-
United States
-
 Uruguay
-
 Uzbekistan
-
 Venezuela
-
 Vietnam
-
 Yemen
-
 Zambia
-
 Zimbabwe
- Forex
- Crypto












