

GSK shares gain about 1.5% after strong technical momentum boosts session highs

GSK plc (GSK) advanced 1.59% on strong short- and medium-term technical momentum, as buyers drove the stock toward session highs. The move is supported by the price crossing above both the 20-day and 50-day moving averages, although longer-term resistance persists near the 200-day average.
 1915.50
1913.50
Highlights
- GSK stock is trading above its short- and medium-term moving averages but faces longer-term technical resistance.
- Mixed technical indicators show strong short-term buying strength, but trend and momentum signals remain neutral overall.
- GSK shares are projected to trade between GBX1,798 and GBX1,899 with a 74% probability of declining in the next five days.
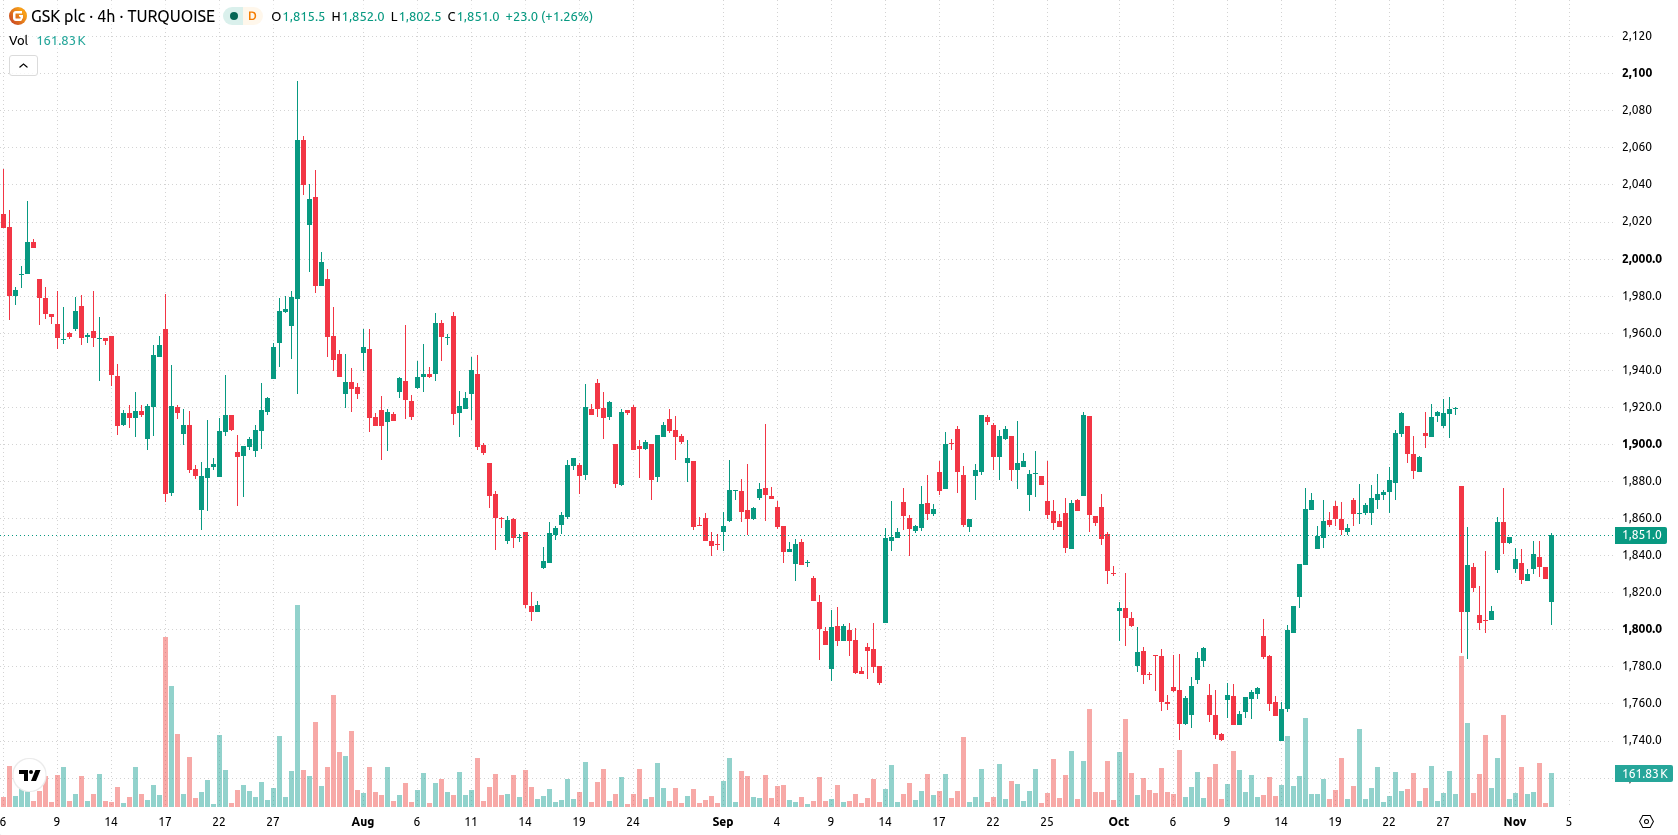
Mixed momentum and capped gains as oscillators diverge near resistance
GSK is trading above its 20-day (GBX1,836) and 50-day (GBX1,842) moving averages, reflecting ongoing bullish pressure in the short and medium term, while remaining under its 200-day average at GBX1,951, which acts as longer-term resistance. Near-term price action is capped by resistance at GBX1,875, with immediate support seen at the 50-day moving average of GBX1,842 and the Ichimoku Kijun at GBX1,832. Momentum signals are mixed: the MACD indicates strong buying, but the Average Directional Index (ADX) is neutral. Both the Relative Strength Index (RSI) and Commodity Channel Index (CCI) are neutral, while the Stochastic RSI is in the oversold zone, suggesting potential for an upside move. Bull/Bear Power (BBP) marks intraday buyer dominance, but the Awesome Oscillator registers selling pressure. Intraday strength has kept the price near the session highs, amid volatility of 1.75%. Oscillator divergences temper the outright bullishness in price action.
Earlier, analysts noted that GSK exhibited persistent technical weakness and a predominantly range-bound outlook driven by fundamental factors. The latest price action introduces short- and medium-term bullish momentum, but with oscillator divergences in play, traders should monitor the 200-day moving average as a critical resistance level for potential trend confirmation.











-
 Afghanistan
-
 Albania
-
 Algeria
-
 Angola
-
 Argentina
-
 Armenia
-
 Australia
-
 Austria
-
 Azerbaijan
-
 Bahamas
-
 Bahrain
-
 Bangladesh
-
 Belarus
-
 Belgium
-
 Bolivia
-
 Botswana
-
 Brazil
-
 Brunei
-
 Bulgaria
-
 Cambodia
-
 Cameroon
-
 Canada
-
 Chile
-
 China
-
 Colombia
-
 Congo
-
 Costa Rica
-
 Cote d'Ivoire
-
 Croatia
-
 Cuba
-
 Cyprus
-
 Czechia
-
 DR Congo
-
 Denmark
-
 Dominican Republic
-
 Ecuador
-
 Egypt
-
 El Salvador
-
 Estonia
-
 Eswatini
-
 Ethiopia
-
 Finland
-
 France
-
 Georgia
-
 Germany
-
 Ghana
-
 Greece
-
 Haiti
-
 Hong Kong
-
 Hungary
-
 India
-
 Indonesia
-
 Iran, Islamic republic
-
 Iraq
-
 Ireland
-
 Israel
-
 Italy
-
 Jamaica
-
 Japan
-
 Jordan
-
 Kazakhstan
-
 Kenya
-
 Korea
-
 Kuwait
-
 Kyrgyzstan
-
 Laos
-
 Latvia
-
 Lebanon
-
 Lesotho
-
 Libya
-
 Lithuania
-
 Luxembourg
-
 Madagascar
-
 Malaysia
-
 Malta
-
 Mauritius
-
 Mexico
-
 Moldova
-
 Mongolia
-
 Montenegro
-
 Morocco
-
 Mozambique
-
 Myanmar
-
 Namibia
-
 Nepal
-
 Netherlands
-
 New Zealand
-
 Nigeria
-
 North Macedonia
-
 Norway
-
 Oman
-
 Pakistan
-
 Palestine
-
 Panama
-
 Papua New Guinea
-
 Paraguay
-
 Peru
-
 Philippines
-
 Poland
-
 Portugal
-
 Puerto Rico
-
 Qatar
-
 Reunion
-
 Romania
-
 Rwanda
-
 Saudi Arabia
-
 Serbia
-
 Singapore
-
 Slovakia
-
 Slovenia
-
 Somalia
-
 South Africa
-
 Spain
-
 Sri Lanka
-
 Sweden
-
 Switzerland
-
 Syria
-
 Taiwan
-
 Tajikistan
-
 Tanzania
-
 Thailand
-
 Trinidad and Tobago
-
 Tunisia
-
 Turkey
-
 UAE
-
 Uganda
-
 Ukraine
-
 United Kingdom
-
United States
-
 Uruguay
-
 Uzbekistan
-
 Venezuela
-
 Vietnam
-
 Yemen
-
 Zambia
-
 Zimbabwe
- Forex
- Crypto












