

Eli Lilly stock weekly forecast: Support at $1,284 comes into focus after recent gains

Shares of Eli Lilly and Company (LLY) are trading near $1,409 as the weekly recovery holds, but momentum is stretched. Attention turns to whether support can withstand the elevated setup as the week begins.
 1434.54
1437.00
Highlights
- Shares of Eli Lilly have edged lower over the past week, holding well above major daily averages in a bullish structure.
- Technical indicators show momentum is overbought, yet underlying trend strength remains intact with MACD indicating ongoing upside momentum.
- For the upcoming week, shares are projected to trade in a $1,340 to $1,478 range, with support at $1,284 and resistance at $1,436.
Revenue guidance raised as obesity and diabetes drugs drive weekly sentiment
Eli Lilly reported strong third-quarter 2026 results with revenue of $24.4 billion and net income of $6.5 billion, driven by robust sales of its obesity drug Zepbound and diabetes treatment Mounjaro, according to Yahoo Finance. The company raised its full-year 2026 revenue guidance to between $91 billion and $92 billion after this outperformance. Product volumes climbed 53%, though realized prices declined 15% as noted by PR Newswire. ETF allocations to LLY shares also increased, led by fresh purchases from XLV.
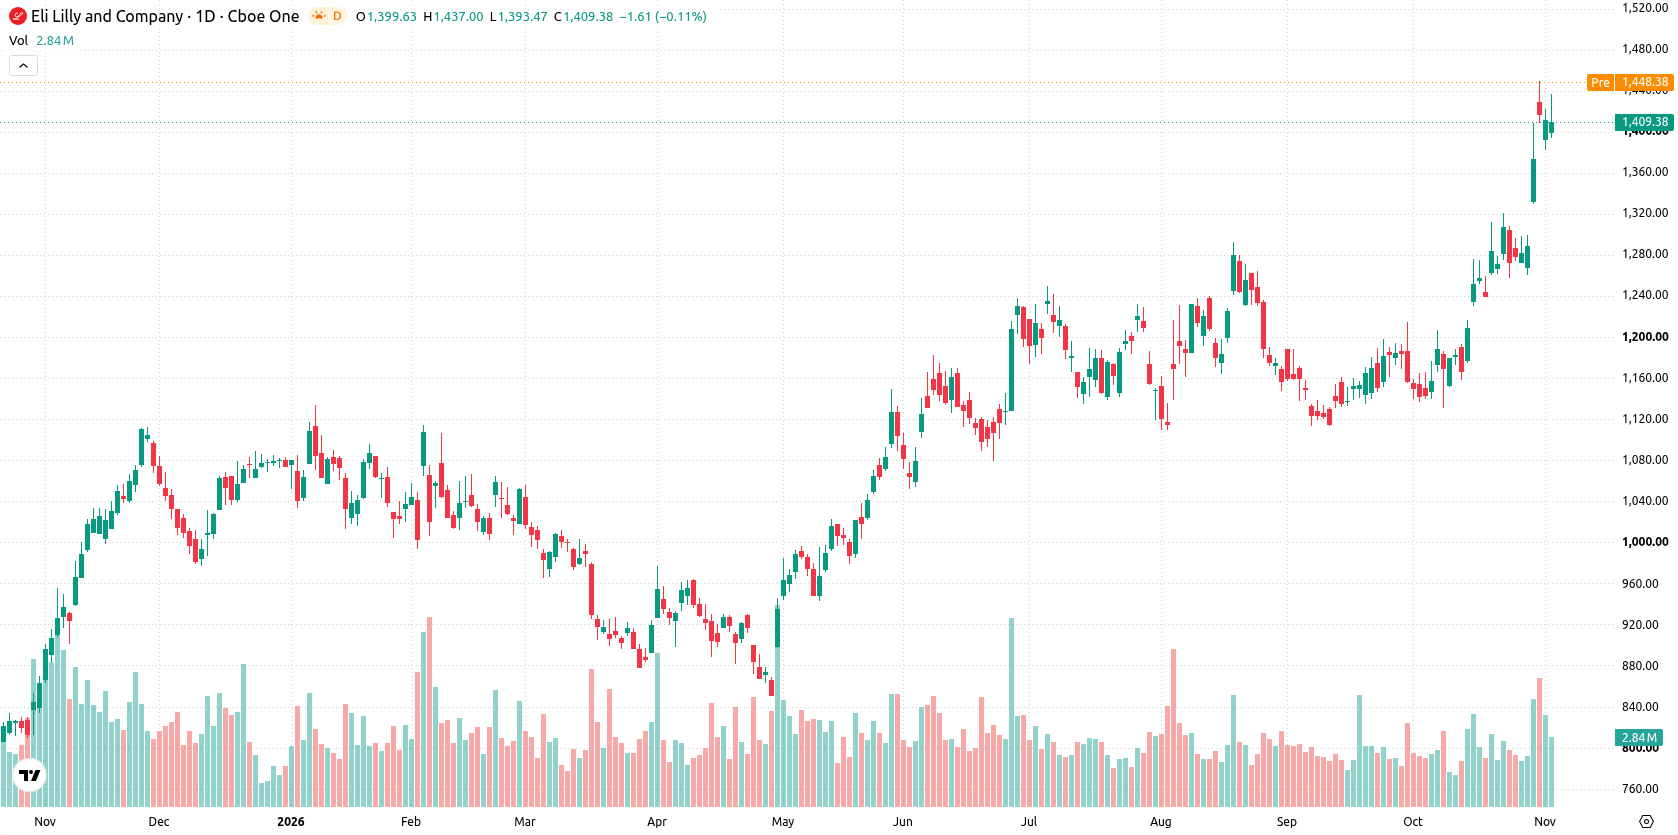
Overbought signals emerge as trend strength persists through the week
On the daily chart, momentum shows signs of potential overheating as RSI, CCI, and Stochastic RSI are all in overbought territory, with RSI at 75.33. Despite the overbought signals, trend strength remains intact and the MACD continues to indicate upside momentum. The nearest support lies at $1,284, anchored by the Ichimoku Kijun, while resistance sits at $1,436 near the weekly high. Recent volatility stands at 11.97%, and the underlying structure suggests a sustained move lower could develop if initial support breaks, but trend continuation has not been invalidated.
Breakout scenarios build as price range narrows in the coming week
For the coming trading week, Eli Lilly shares are expected to trade within a range of $1,340 to $1,478. There is a 78% probability of an increase and a 22% probability of a decrease. The base case favors price holding between support at $1,284 and resistance at $1,436. A sustained breakout above $1,436 would open the door for further gains toward the high end of the expected range. Conversely, a decisive move below $1,284 could trigger a deeper downside correction.
Earlier, analysts noted that Eli Lilly's strong earnings and rising revenue expectations were fueling a sustained bullish bias in the stock. With momentum now stretched and technical signals indicating overbought conditions, the key focus for traders shifts to whether support near $1,284 can withstand potential downside pressure in the near term.






Latest Eli Lilly and Company News




-
 Afghanistan
-
 Albania
-
 Algeria
-
 Angola
-
 Argentina
-
 Armenia
-
 Australia
-
 Austria
-
 Azerbaijan
-
 Bahamas
-
 Bahrain
-
 Bangladesh
-
 Belarus
-
 Belgium
-
 Bolivia
-
 Botswana
-
 Brazil
-
 Brunei
-
 Bulgaria
-
 Cambodia
-
 Cameroon
-
 Canada
-
 Chile
-
 China
-
 Colombia
-
 Congo
-
 Costa Rica
-
 Cote d'Ivoire
-
 Croatia
-
 Cuba
-
 Cyprus
-
 Czechia
-
 DR Congo
-
 Denmark
-
 Dominican Republic
-
 Ecuador
-
 Egypt
-
 El Salvador
-
 Estonia
-
 Eswatini
-
 Ethiopia
-
 Finland
-
 France
-
 Georgia
-
 Germany
-
 Ghana
-
 Greece
-
 Haiti
-
 Hong Kong
-
 Hungary
-
 India
-
 Indonesia
-
 Iran, Islamic republic
-
 Iraq
-
 Ireland
-
 Israel
-
 Italy
-
 Jamaica
-
 Japan
-
 Jordan
-
 Kazakhstan
-
 Kenya
-
 Korea
-
 Kuwait
-
 Kyrgyzstan
-
 Laos
-
 Latvia
-
 Lebanon
-
 Lesotho
-
 Libya
-
 Lithuania
-
 Luxembourg
-
 Madagascar
-
 Malaysia
-
 Malta
-
 Mauritius
-
 Mexico
-
 Moldova
-
 Mongolia
-
 Montenegro
-
 Morocco
-
 Mozambique
-
 Myanmar
-
 Namibia
-
 Nepal
-
 Netherlands
-
 New Zealand
-
 Nigeria
-
 North Macedonia
-
 Norway
-
 Oman
-
 Pakistan
-
 Palestine
-
 Panama
-
 Papua New Guinea
-
 Paraguay
-
 Peru
-
 Philippines
-
 Poland
-
 Portugal
-
 Puerto Rico
-
 Qatar
-
 Reunion
-
 Romania
-
 Rwanda
-
 Saudi Arabia
-
 Serbia
-
 Singapore
-
 Slovakia
-
 Slovenia
-
 Somalia
-
 South Africa
-
 Spain
-
 Sri Lanka
-
 Sweden
-
 Switzerland
-
 Syria
-
 Taiwan
-
 Tajikistan
-
 Tanzania
-
 Thailand
-
 Trinidad and Tobago
-
 Tunisia
-
 Turkey
-
 UAE
-
 Uganda
-
 Ukraine
-
 United Kingdom
-
United States
-
 Uruguay
-
 Uzbekistan
-
 Venezuela
-
 Vietnam
-
 Yemen
-
 Zambia
-
 Zimbabwe
- Forex
- Crypto












