

Eli Lilly quarterly earnings beat and guidance boost: Can LLY continue gains?

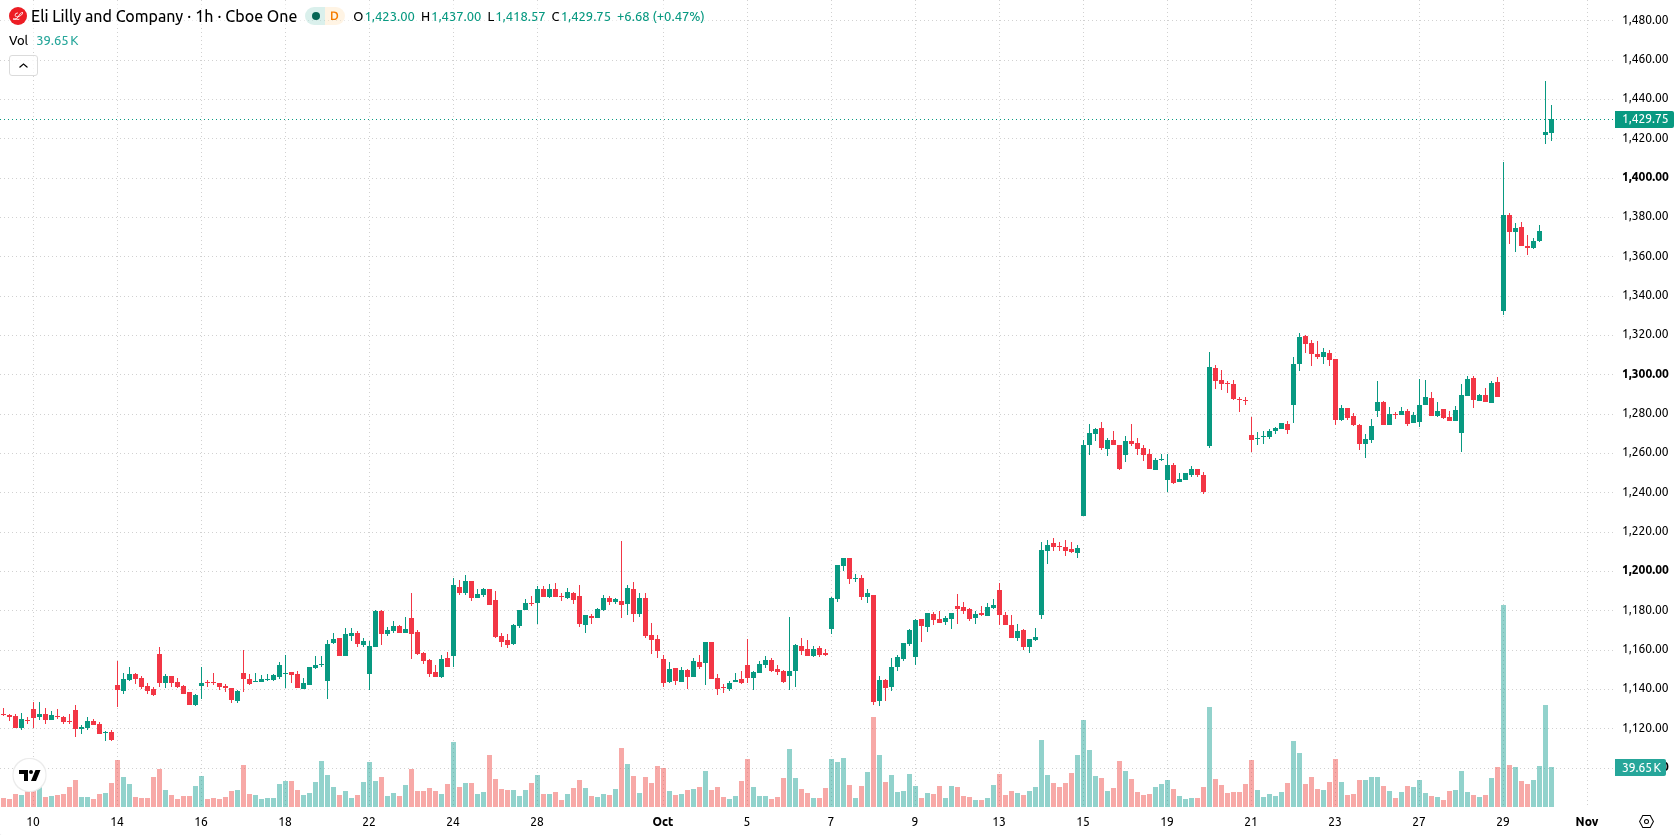
Eli Lilly (LLY) stock is trading at $1,434, up 4.41% on the day. The price is well above its key moving averages, reflecting clear bullish momentum at multiple timeframes.
 1449.68
Highlights
- Eli Lilly reported third-quarter 2026 revenue rising 39% year over year to $24.4 billion on strong Mounjaro and Zepbound sales.
- The company raised its full-year revenue guidance to $91 to $92 billion as non-GAAP EPS reached $7.48 and results beat Wall Street estimates.
- Shares of Eli Lilly gained 4.41% today, trading near $1,434 with a projected two to three day range of $1,362 to $1,500, supported by strong bullish technical signals.
Revenue surge and raised outlook drive bullish market sentiment
Eli Lilly's third-quarter 2026 results revealed a 39% year-over-year revenue surge to $24.4 billion, powered by strong sales of Mounjaro and Zepbound, according to PR Newswire. This robust financial performance prompted the company to raise its full-year revenue guidance to $91–$92 billion, underscoring management's confidence in continued product momentum. Furthermore, non-GAAP EPS reached $7.48 for the quarter, and the results exceeded Wall Street estimates, fueling positive sentiment in the market.
Technical signals remain bullish despite mixed oscillator confirmation
LLY is firmly above the MA-20 and MA-50 on the hourly chart, and also stands well above the MA-200 on the daily chart. The Ichimoku Kijun currently sits at $1,334 as immediate support. On the indicator front, MACD and ADX both indicate a Buy signal, while RSI, Stoch RSI, and CCI are holding in Buy or overbought territory. Bull/Bear Power remains strongly in favor of buyers. The Awesome Oscillator is neutral and does not confirm the upward momentum seen in other signals, which slightly tempers the otherwise bullish technical picture. Volatility remains elevated following the negative gap at the open.
High upside probability as price eyes breakout above resistance
Looking ahead to the next 2–3 trading days, the expected trading range is $1,362 to $1,500, reflecting typical volatility in the current environment. The probability of continued upward movement is very high, while a move below $1,362 has low likelihood. Baseline scenario envisions price consolidating within this corridor. A bullish breakout would target a move above $1,500 resistance and continuation of the uptrend, while a decline below $1,362 would open room for a deeper pullback.
Earlier, analysts noted that Eli Lilly's strong earnings momentum and rising revenue expectations were driving a sustained bullish bias in the stock. The latest price action and updated technical signals reinforce this trend, making the $1,500 level a critical resistance for traders to monitor in the coming sessions.






Latest Eli Lilly and Company News




-
 Afghanistan
-
 Albania
-
 Algeria
-
 Angola
-
 Argentina
-
 Armenia
-
 Australia
-
 Austria
-
 Azerbaijan
-
 Bahamas
-
 Bahrain
-
 Bangladesh
-
 Belarus
-
 Belgium
-
 Bolivia
-
 Botswana
-
 Brazil
-
 Brunei
-
 Bulgaria
-
 Cambodia
-
 Cameroon
-
 Canada
-
 Chile
-
 China
-
 Colombia
-
 Congo
-
 Costa Rica
-
 Cote d'Ivoire
-
 Croatia
-
 Cuba
-
 Cyprus
-
 Czechia
-
 DR Congo
-
 Denmark
-
 Dominican Republic
-
 Ecuador
-
 Egypt
-
 El Salvador
-
 Estonia
-
 Eswatini
-
 Ethiopia
-
 Finland
-
 France
-
 Georgia
-
 Germany
-
 Ghana
-
 Greece
-
 Haiti
-
 Hong Kong
-
 Hungary
-
 India
-
 Indonesia
-
 Iran, Islamic republic
-
 Iraq
-
 Ireland
-
 Israel
-
 Italy
-
 Jamaica
-
 Japan
-
 Jordan
-
 Kazakhstan
-
 Kenya
-
 Korea
-
 Kuwait
-
 Kyrgyzstan
-
 Laos
-
 Latvia
-
 Lebanon
-
 Lesotho
-
 Libya
-
 Lithuania
-
 Luxembourg
-
 Madagascar
-
 Malaysia
-
 Malta
-
 Mauritius
-
 Mexico
-
 Moldova
-
 Mongolia
-
 Montenegro
-
 Morocco
-
 Mozambique
-
 Myanmar
-
 Namibia
-
 Nepal
-
 Netherlands
-
 New Zealand
-
 Nigeria
-
 North Macedonia
-
 Norway
-
 Oman
-
 Pakistan
-
 Palestine
-
 Panama
-
 Papua New Guinea
-
 Paraguay
-
 Peru
-
 Philippines
-
 Poland
-
 Portugal
-
 Puerto Rico
-
 Qatar
-
 Reunion
-
 Romania
-
 Rwanda
-
 Saudi Arabia
-
 Serbia
-
 Singapore
-
 Slovakia
-
 Slovenia
-
 Somalia
-
 South Africa
-
 Spain
-
 Sri Lanka
-
 Sweden
-
 Switzerland
-
 Syria
-
 Taiwan
-
 Tajikistan
-
 Tanzania
-
 Thailand
-
 Trinidad and Tobago
-
 Tunisia
-
 Turkey
-
 UAE
-
 Uganda
-
 Ukraine
-
 United Kingdom
-
United States
-
 Uruguay
-
 Uzbekistan
-
 Venezuela
-
 Vietnam
-
 Yemen
-
 Zambia
-
 Zimbabwe
- Forex
- Crypto












