

Eli Lilly shares weekly forecast: Recovery supported by bullish momentum indicators

Shares of Eli Lilly and Company (LLY) are trading near $1,431 after gaining roughly 5% over the past week, supported by steady demand for the company's new drug lines. With corporate momentum still in play, the recovery setup carries into this week — but the stretch in signals calls for attention to both trend strength and risks as trading resumes.
 1449.64
1460.00
Highlights
- Shares of Eli Lilly gained 5.05% to $1,431, reaching the upper boundary of the recent weekly trading range.
- The stock remains well above key moving averages with strong bullish momentum but exhibits overbought signals and increased volatility.
- Forecast for the coming week anticipates a range of $1,389 to $1,528, with a breakout above $1,449 triggering further upside and support below at $1,354.
Revenue upgrade absorbs FDA risk as GLP-1 momentum sustains bullish sentiment
Eli Lilly raised its 2026 revenue forecast by $5.5 billion last week, citing robust demand for its GLP-1 drugs, according to The Motley Fool. The company also reported annual revenue of $65.18 billion and net profit of $20.64 billion. Meanwhile, the FDA issued new vision-loss warnings for GLP-1 products including Lilly's Mounjaro and Zepbound, but the update left the stock unaffected as pointed out by IBTimes.
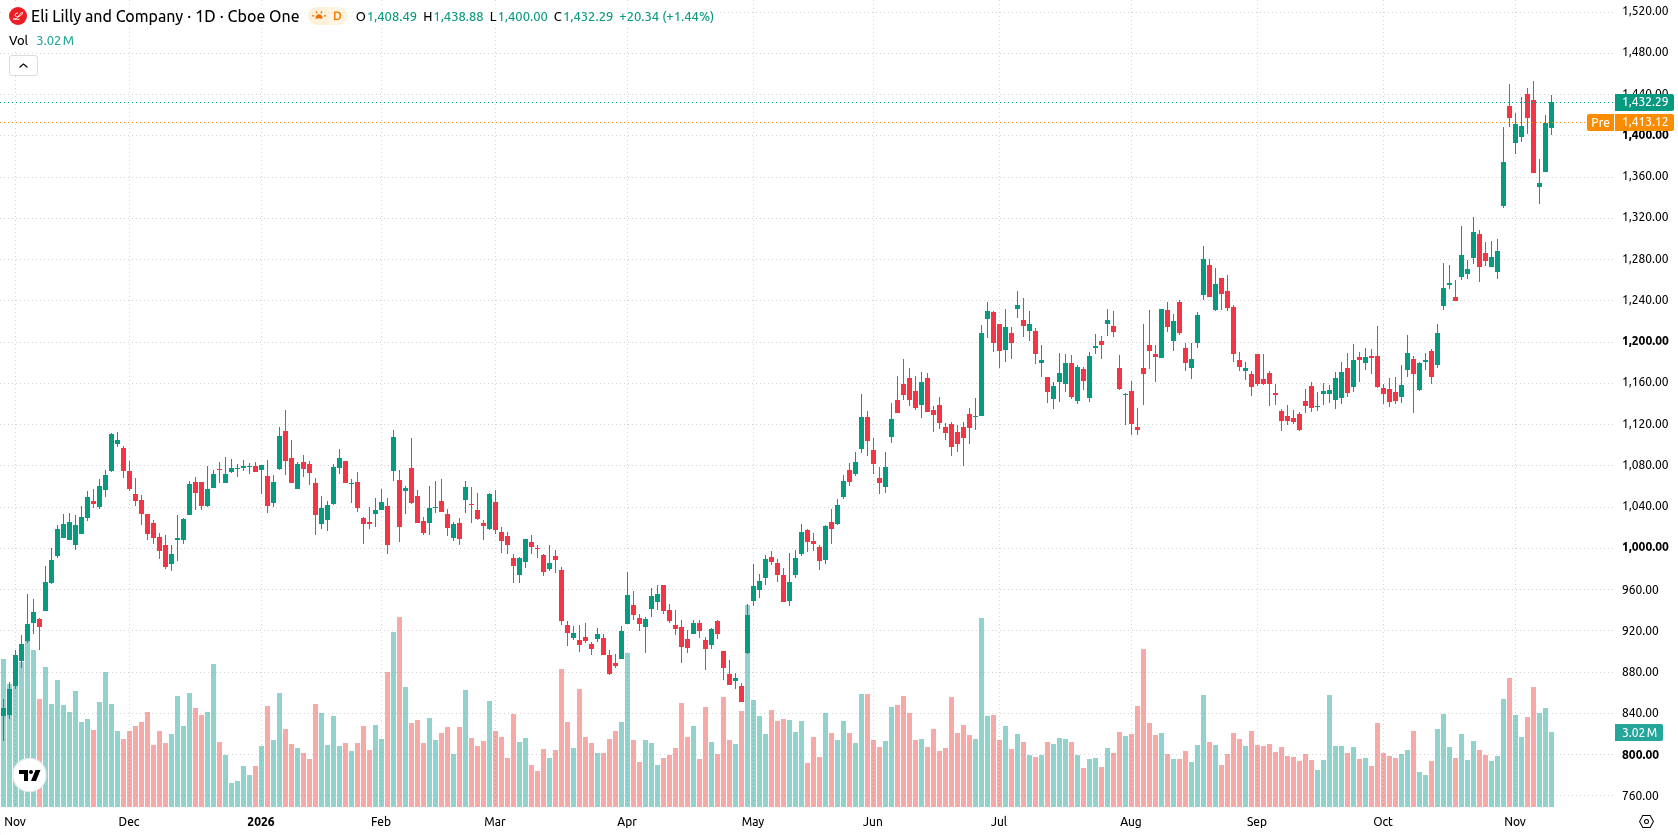
Overbought RSI flags correction risk as bullish momentum persists this week
On the daily chart, Eli Lilly displays a sustained move higher with a firm trend and elevated volatility of 7.01%. The RSI reads 70.77, marking the stock as overbought and signaling possible overheating and correction risk, while the MACD and ADX both indicate strong upward momentum. Immediate support is seen at $1,354, reinforced by the Ichimoku Kijun at $1,290, with resistance at $1,449. The strong price positioning above key moving averages and bullish momentum indicators point to continued upside, though the overbought RSI highlights potential for short-term pullbacks.
Further upside favored as bullish signals frame coming week’s range
Over the coming trading week, price action is expected between $1,389 and $1,528, with a very high probability of further gains and a very low probability of a decrease. The base case anticipates consolidation or further upside within the stated range, supported by underlying trend signals. A bullish break above $1,449 could see momentum accelerate toward the upper range target, while a move below $1,354 would risk a deeper pullback toward practical support at $1,290.
Earlier, analysts noted that Eli Lilly’s growth prospects were supported by clinical progress and expanding distribution partnerships, reinforcing a positive technical outlook. The renewed revenue guidance and resilient price action in the current period add further weight to this view, making the $1,449 resistance a pivotal level to monitor for potential breakout momentum in the days ahead.






Latest Eli Lilly and Company News




-
 Afghanistan
-
 Albania
-
 Algeria
-
 Angola
-
 Argentina
-
 Armenia
-
 Australia
-
 Austria
-
 Azerbaijan
-
 Bahamas
-
 Bahrain
-
 Bangladesh
-
 Belarus
-
 Belgium
-
 Bolivia
-
 Botswana
-
 Brazil
-
 Brunei
-
 Bulgaria
-
 Cambodia
-
 Cameroon
-
 Canada
-
 Chile
-
 China
-
 Colombia
-
 Congo
-
 Costa Rica
-
 Cote d'Ivoire
-
 Croatia
-
 Cuba
-
 Cyprus
-
 Czechia
-
 DR Congo
-
 Denmark
-
 Dominican Republic
-
 Ecuador
-
 Egypt
-
 El Salvador
-
 Estonia
-
 Eswatini
-
 Ethiopia
-
 Finland
-
 France
-
 Georgia
-
 Germany
-
 Ghana
-
 Greece
-
 Haiti
-
 Hong Kong
-
 Hungary
-
 India
-
 Indonesia
-
 Iran, Islamic republic
-
 Iraq
-
 Ireland
-
 Israel
-
 Italy
-
 Jamaica
-
 Japan
-
 Jordan
-
 Kazakhstan
-
 Kenya
-
 Korea
-
 Kuwait
-
 Kyrgyzstan
-
 Laos
-
 Latvia
-
 Lebanon
-
 Lesotho
-
 Libya
-
 Lithuania
-
 Luxembourg
-
 Madagascar
-
 Malaysia
-
 Malta
-
 Mauritius
-
 Mexico
-
 Moldova
-
 Mongolia
-
 Montenegro
-
 Morocco
-
 Mozambique
-
 Myanmar
-
 Namibia
-
 Nepal
-
 Netherlands
-
 New Zealand
-
 Nigeria
-
 North Macedonia
-
 Norway
-
 Oman
-
 Pakistan
-
 Palestine
-
 Panama
-
 Papua New Guinea
-
 Paraguay
-
 Peru
-
 Philippines
-
 Poland
-
 Portugal
-
 Puerto Rico
-
 Qatar
-
 Reunion
-
 Romania
-
 Rwanda
-
 Saudi Arabia
-
 Serbia
-
 Singapore
-
 Slovakia
-
 Slovenia
-
 Somalia
-
 South Africa
-
 Spain
-
 Sri Lanka
-
 Sweden
-
 Switzerland
-
 Syria
-
 Taiwan
-
 Tajikistan
-
 Tanzania
-
 Thailand
-
 Trinidad and Tobago
-
 Tunisia
-
 Turkey
-
 UAE
-
 Uganda
-
 Ukraine
-
 United Kingdom
-
United States
-
 Uruguay
-
 Uzbekistan
-
 Venezuela
-
 Vietnam
-
 Yemen
-
 Zambia
-
 Zimbabwe
- Forex
- Crypto












