

Will Eli Lilly stock hold the $1,356 support as sellers dominate after price drop?

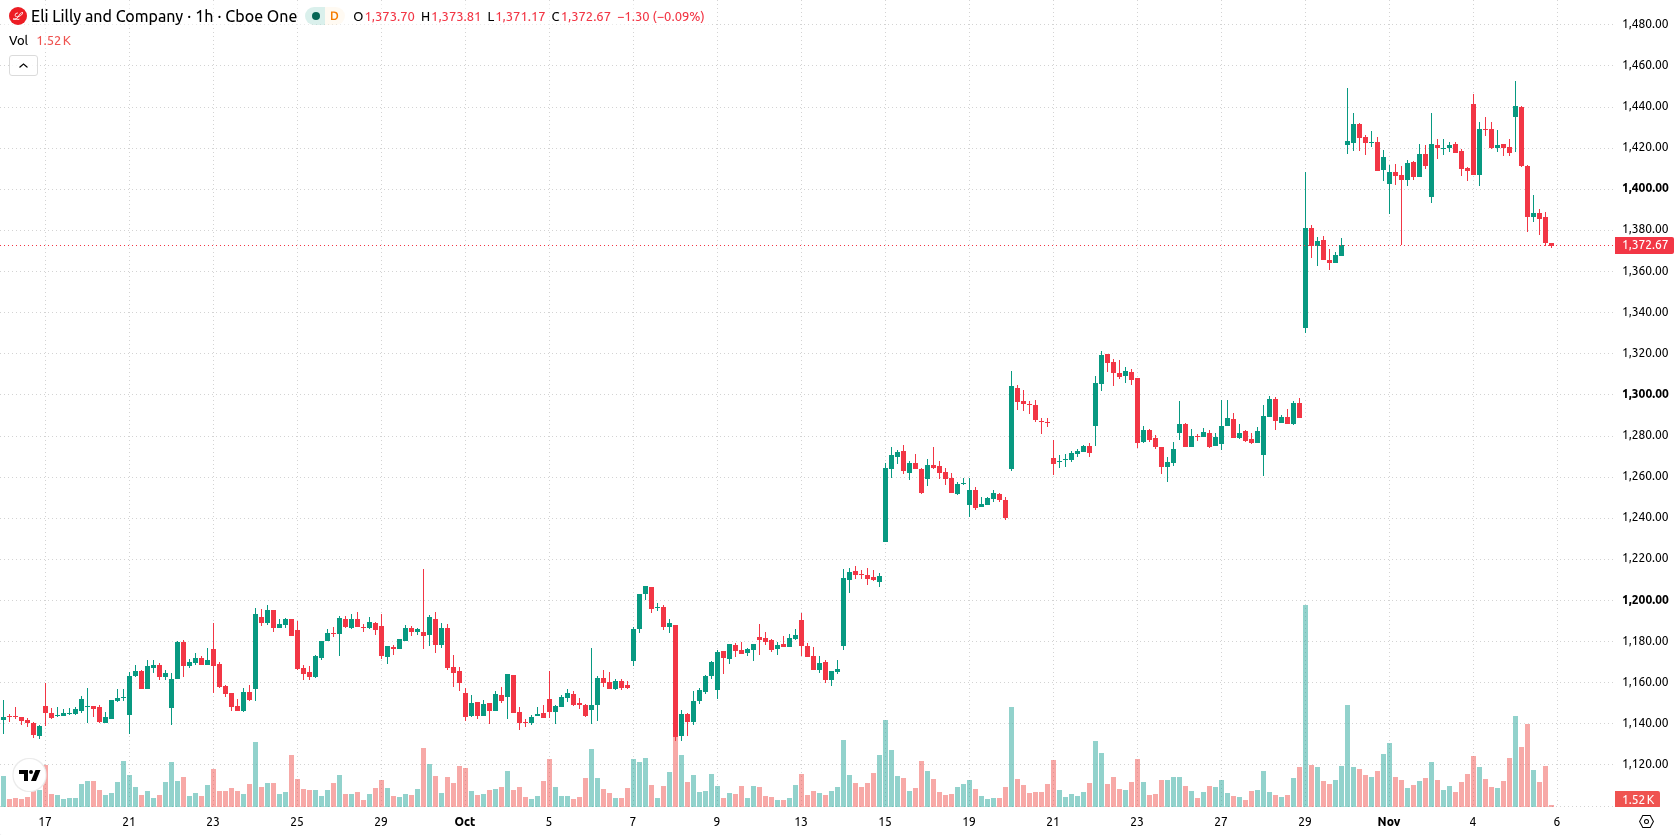
Eli Lilly (LLY) stock is trading at $1,371, down 3.2% on the day. The price sits below its key short- and medium-term moving averages, with additional downside momentum evident near the session low.
 1377.28
1449.69
Highlights
- Eli Lilly revenue surged 53% in volume to $24.4 billion in the third quarter, with annual revenue guidance raised to $91 to $92 billion.
- Eli Lilly distributed $1.5 billion in dividends and executed $400 million in share repurchases, while intensifying legal action to defend its weight loss drug franchise.
- Shares of Eli Lilly closed down 3.2% at $1,371 amid strong intraday selling, with technicals indicating a sideways price range of $1,356 to $1,387 over the next 2 to 3 days.
Guidance boost and franchise defense amid profit-taking pressures
Eli Lilly reported strong third-quarter 2026 results on October 29, with revenue reaching $24.4 billion and worldwide volume increasing 53%, even as realized prices fell 15%, according to Seeking Alpha and TradingKey. The company also raised its annual revenue guidance to $91–92 billion, reflecting confidence in sustained demand and ongoing growth at scale. During the third quarter, Eli Lilly returned $1.5 billion to shareholders through dividends and completed $400 million in share repurchases, as noted by Yahoo Finance. Legal and regulatory action continued as the company intensified pressure on providers of compounded Tirzepatide+ weight loss drugs and forced changes to a competitor's advertising strategy, moves aimed at protecting Eli Lilly's key franchises — though price action has remained under broader selling pressure.
Momentum mixed as oscillators warn of possible overheating
On the technical front, LLY/USD is trading below the MA-20 and MA-50 on the hourly chart, while remaining above the MA-200 on the daily timeframe. Immediate resistance is set by the Ichimoku Kijun at $1,405, with support positioned at $1,356. Among indicators, MACD shows a strong buy signal, ADX and the Awesome Oscillator are neutral, and Bull/Bear Power remains strongly positive, reflecting ongoing buyer activity intraday. RSI is neutral, while both Stochastic RSI and CCI are in overbought territory, highlighting potential for near-term overheating but not confirming a reversal.
Sideways range expected as upside risk outweighs breakdown
Over the next 2–3 trading days, LLY is expected to trade between $1,356 and $1,387, representing its typical volatility band relative to current levels. The baseline scenario anticipates sideways consolidation. If price breaks above immediate resistance at $1,405, a bullish move could develop, while a failure of support at $1,356 would open the path for further declines. The probability of an upward move is assessed at 59%, making a downward move less likely in the short term.
Earlier, analysts noted that Eli Lilly’s strong earnings and raised revenue guidance were supporting a bullish bias, although technical signals warned of overbought conditions and possible downside risk. With the current move below key moving averages and downside momentum in play, traders should watch support at $1,356 as a break below this level could prompt increased volatility and further weakness in the near term.






Latest Eli Lilly and Company News




-
 Afghanistan
-
 Albania
-
 Algeria
-
 Angola
-
 Argentina
-
 Armenia
-
 Australia
-
 Austria
-
 Azerbaijan
-
 Bahamas
-
 Bahrain
-
 Bangladesh
-
 Belarus
-
 Belgium
-
 Bolivia
-
 Botswana
-
 Brazil
-
 Brunei
-
 Bulgaria
-
 Cambodia
-
 Cameroon
-
 Canada
-
 Chile
-
 China
-
 Colombia
-
 Congo
-
 Costa Rica
-
 Cote d'Ivoire
-
 Croatia
-
 Cuba
-
 Cyprus
-
 Czechia
-
 DR Congo
-
 Denmark
-
 Dominican Republic
-
 Ecuador
-
 Egypt
-
 El Salvador
-
 Estonia
-
 Eswatini
-
 Ethiopia
-
 Finland
-
 France
-
 Georgia
-
 Germany
-
 Ghana
-
 Greece
-
 Haiti
-
 Hong Kong
-
 Hungary
-
 India
-
 Indonesia
-
 Iran, Islamic republic
-
 Iraq
-
 Ireland
-
 Israel
-
 Italy
-
 Jamaica
-
 Japan
-
 Jordan
-
 Kazakhstan
-
 Kenya
-
 Korea
-
 Kuwait
-
 Kyrgyzstan
-
 Laos
-
 Latvia
-
 Lebanon
-
 Lesotho
-
 Libya
-
 Lithuania
-
 Luxembourg
-
 Madagascar
-
 Malaysia
-
 Malta
-
 Mauritius
-
 Mexico
-
 Moldova
-
 Mongolia
-
 Montenegro
-
 Morocco
-
 Mozambique
-
 Myanmar
-
 Namibia
-
 Nepal
-
 Netherlands
-
 New Zealand
-
 Nigeria
-
 North Macedonia
-
 Norway
-
 Oman
-
 Pakistan
-
 Palestine
-
 Panama
-
 Papua New Guinea
-
 Paraguay
-
 Peru
-
 Philippines
-
 Poland
-
 Portugal
-
 Puerto Rico
-
 Qatar
-
 Reunion
-
 Romania
-
 Rwanda
-
 Saudi Arabia
-
 Serbia
-
 Singapore
-
 Slovakia
-
 Slovenia
-
 Somalia
-
 South Africa
-
 Spain
-
 Sri Lanka
-
 Sweden
-
 Switzerland
-
 Syria
-
 Taiwan
-
 Tajikistan
-
 Tanzania
-
 Thailand
-
 Trinidad and Tobago
-
 Tunisia
-
 Turkey
-
 UAE
-
 Uganda
-
 Ukraine
-
 United Kingdom
-
United States
-
 Uruguay
-
 Uzbekistan
-
 Venezuela
-
 Vietnam
-
 Yemen
-
 Zambia
-
 Zimbabwe
- Forex
- Crypto












