

IBM stock shows mixed bias amid downside pressure and resilience from long-term indicators: weekly analysis

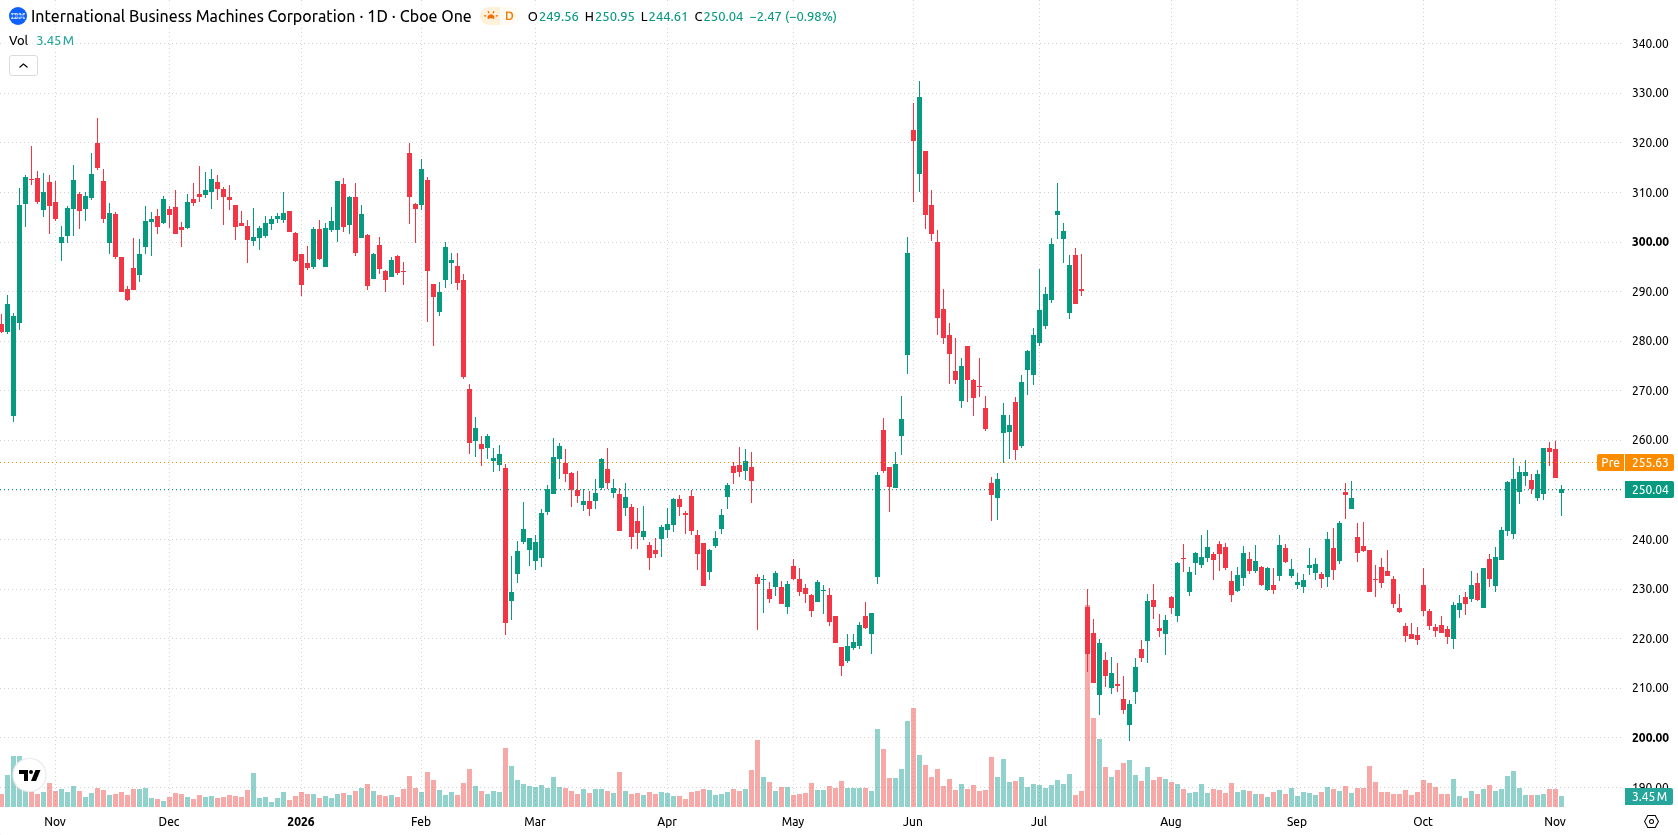
Shares of International Business Machines Corporation (IBM) are trading near $250 following a decline of just over 3% this past week, as the stock holds above key moving averages but shows uncertainty amid contrasting signals. Downside pressure persists as momentum indicators diverge, leaving the near-term bias balanced between resilience from long-term technicals and caution from recent weakness. This mixed setup shapes expectations for the coming week.
 246.34
259.84
Highlights
- Shares of IBM fell 3.03% over the past week to $250.04, holding modestly above the 200-day moving average.
- The longer-term technical structure is bullish, though current oscillators stay neutral with no clear overbought or oversold signals.
- IBM stock is projected to trade between $243.28 and $256.79 this week, with key support at $248.65 and resistance at $259.84.
Shareholder returns draw scrutiny as debt rise prompts investor caution
IBM continued its pattern of robust shareholder returns, delivering $1.6 billion in dividends for the third quarter and approving a quarterly dividend of $1.69 per share, as reported by Beinsure. However, concerns have surfaced about the sustainability of this streak amid higher debt levels, according to Yahoo Finance. Some institutional investors, including Sumitomo Mitsui Trust Group and Asset Management One, trimmed their holdings in IBM during the third quarter.
Neutral oscillator signals contain volatility as MACD and ADX trend higher
On the daily chart, the setup shows a sustained move lower with a firm trend, as reflected in a volatility reading of 6.17%. MACD and ADX both signal upward momentum, yet oscillators such as RSI (57.76), CCI (43.82), and Stochastic RSI are in neutral zones, suggesting neither excessive buying nor selling pressure at present. Immediate support aligns with the MA-200 at $248.65, while resistance stands at $259.84, close to the recent weekly high. The constructive longer-term backdrop adds additional context, but near-term price action favors caution within the current daily range.
Bullish bias holds next week if resistance breaks amid tight range
In the week ahead, IBM is expected to trade between $243.28 and $256.79, with a 63% probability of an increase versus 37% for a decrease. The base case sees the stock oscillating between the defined support at $248.65 and resistance at $259.84. A push above resistance could open the way to further gains, while a break below support at $248.65 would expose the lower boundary of the expected range. Traders should watch these levels closely as directional signals consolidate.
Earlier, analysts noted that IBM’s recovery depended on sustaining support above key technical levels amid an evolving business and regulatory landscape. The current analysis adds a layer of caution, highlighting the importance of $248.65 support as a trigger for renewed downside risk should it fail in the week ahead.






Latest IBM News




-
 Afghanistan
-
 Albania
-
 Algeria
-
 Angola
-
 Argentina
-
 Armenia
-
 Australia
-
 Austria
-
 Azerbaijan
-
 Bahamas
-
 Bahrain
-
 Bangladesh
-
 Belarus
-
 Belgium
-
 Bolivia
-
 Botswana
-
 Brazil
-
 Brunei
-
 Bulgaria
-
 Cambodia
-
 Cameroon
-
 Canada
-
 Chile
-
 China
-
 Colombia
-
 Congo
-
 Costa Rica
-
 Cote d'Ivoire
-
 Croatia
-
 Cuba
-
 Cyprus
-
 Czechia
-
 DR Congo
-
 Denmark
-
 Dominican Republic
-
 Ecuador
-
 Egypt
-
 El Salvador
-
 Estonia
-
 Eswatini
-
 Ethiopia
-
 Finland
-
 France
-
 Georgia
-
 Germany
-
 Ghana
-
 Greece
-
 Haiti
-
 Hong Kong
-
 Hungary
-
 India
-
 Indonesia
-
 Iran, Islamic republic
-
 Iraq
-
 Ireland
-
 Israel
-
 Italy
-
 Jamaica
-
 Japan
-
 Jordan
-
 Kazakhstan
-
 Kenya
-
 Korea
-
 Kuwait
-
 Kyrgyzstan
-
 Laos
-
 Latvia
-
 Lebanon
-
 Lesotho
-
 Libya
-
 Lithuania
-
 Luxembourg
-
 Madagascar
-
 Malaysia
-
 Malta
-
 Mauritius
-
 Mexico
-
 Moldova
-
 Mongolia
-
 Montenegro
-
 Morocco
-
 Mozambique
-
 Myanmar
-
 Namibia
-
 Nepal
-
 Netherlands
-
 New Zealand
-
 Nigeria
-
 North Macedonia
-
 Norway
-
 Oman
-
 Pakistan
-
 Palestine
-
 Panama
-
 Papua New Guinea
-
 Paraguay
-
 Peru
-
 Philippines
-
 Poland
-
 Portugal
-
 Puerto Rico
-
 Qatar
-
 Reunion
-
 Romania
-
 Rwanda
-
 Saudi Arabia
-
 Serbia
-
 Singapore
-
 Slovakia
-
 Slovenia
-
 Somalia
-
 South Africa
-
 Spain
-
 Sri Lanka
-
 Sweden
-
 Switzerland
-
 Syria
-
 Taiwan
-
 Tajikistan
-
 Tanzania
-
 Thailand
-
 Trinidad and Tobago
-
 Tunisia
-
 Turkey
-
 UAE
-
 Uganda
-
 Ukraine
-
 United Kingdom
-
United States
-
 Uruguay
-
 Uzbekistan
-
 Venezuela
-
 Vietnam
-
 Yemen
-
 Zambia
-
 Zimbabwe
- Forex
- Crypto












