

Apple stock forecast: Rangebound volatility with upside potential eyeing $361.28 resistance

Apple Inc. (AAPL) stock is trading at $349.5, up 5.3% on the day. The price sits above its key moving averages, reflecting continued upside momentum.
 360.34
Highlights
- Apple completed a seven-part investment-grade bond sale, adding liquidity after posting $114.5 billion in quarterly revenue and $2.10 earnings per share.
- The company kept $137 billion in cash and marketable securities against $80 billion in debt, with $28 billion returned to shareholders alongside policy actions on insider trading and AI risk.
- Apple stock advanced 5.3% to $349.5, showing bullish momentum, with an expected 2 to 3 day range of $337.72 to $361.28 and 74% probability of an upward move.
Record revenue and balance sheet strength fuel debt sale and governance focus
Apple's entry into the investment-grade bond market with a seven-part debt sale, as reported by Bloomberg, provides the company with enhanced liquidity and demonstrates confidence in the current capital cost environment. This move comes as Apple reported record quarterly revenue of $114.5 billion and earnings per share of $2.10 in its fiscal 2026 fourth quarter, indicating strong operational momentum according to 247wallst. The company also maintained a robust balance sheet with $137 billion in cash and marketable securities against $80 billion in debt, returning $28 billion to shareholders and declaring a quarterly dividend, based on data from Tipranks. Additional regulatory disclosures and policy updates on insider trading and AI risk, as well as its opposition to stock tokenization initiatives, reflect Apple's focus on governance and compliance.
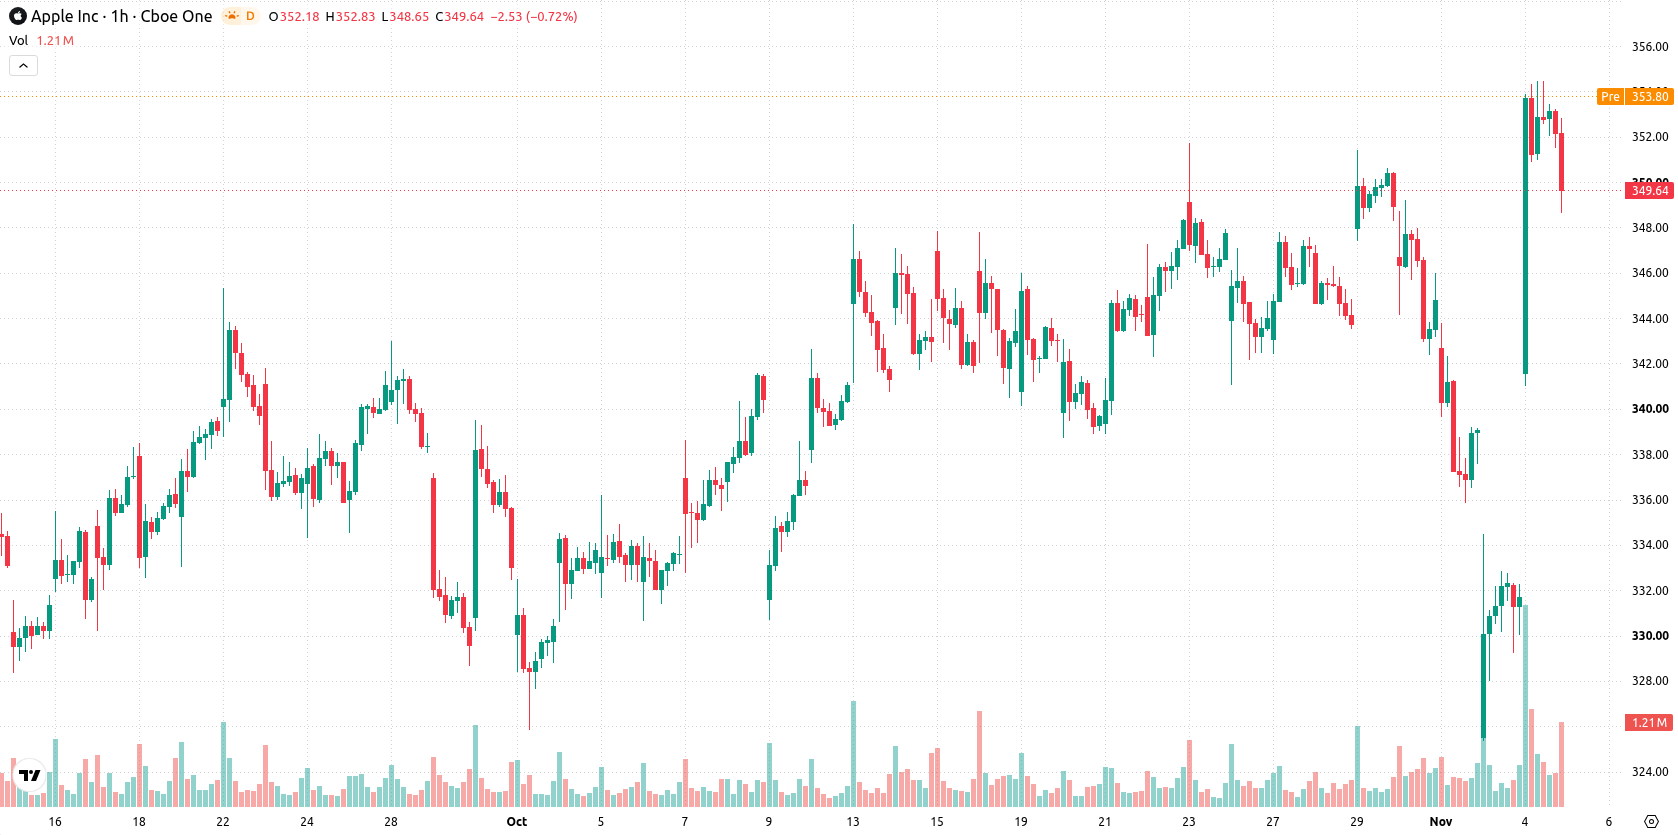
Price gap volatility emerges as momentum stays constructive but neutral signals rise
On the technical front, AAPL/USD trades above the MA-20 at $340.79 and MA-50 at $344.15, with the price well clear of the long-term MA-200 at $297.87. The nearest defined support is the Ichimoku Kijun level at $339.9. Momentum indicators remain constructive: MACD and ADX both signal buy conditions, while RSI, Stoch RSI, and CCI are all neutral, indicating no overbought or oversold bias. Bull/Bear Power is positive at 6.5, suggesting intraday buying strength, while the Awesome Oscillator is neutral. A sharp 5.3% gain and an upside price gap of 20.68 signal volatility, but the price now sits at the lower end of the session range, raising caution about possible short-term divergences.
Rangebound outlook persists as breakout or breakdown risks increase
Over the next two to three days, the expected trading range for AAPL/USD is $337.72 to $361.28. The base scenario envisages continued rangebound trading within this volatility band. If the price decisively exceeds the upper boundary, a renewed bullish push may develop; alternatively, a fall below support near $337.72 could signal further corrective downside. The probability of further gains is assessed at 74% versus a 26% likelihood of a pullback.
Previously it was reported that Apple implemented stricter internal AI spending controls in response to rising costs and sector-wide governance pressures. The company’s recent bond issuance, record financial performance, and updates in compliance policy add further stability to its operational outlook, with traders advised to monitor the defined $337.72 to $361.28 range for near-term directional cues.











-
 Afghanistan
-
 Albania
-
 Algeria
-
 Angola
-
 Argentina
-
 Armenia
-
 Australia
-
 Austria
-
 Azerbaijan
-
 Bahamas
-
 Bahrain
-
 Bangladesh
-
 Belarus
-
 Belgium
-
 Bolivia
-
 Botswana
-
 Brazil
-
 Brunei
-
 Bulgaria
-
 Cambodia
-
 Cameroon
-
 Canada
-
 Chile
-
 China
-
 Colombia
-
 Congo
-
 Costa Rica
-
 Cote d'Ivoire
-
 Croatia
-
 Cuba
-
 Cyprus
-
 Czechia
-
 DR Congo
-
 Denmark
-
 Dominican Republic
-
 Ecuador
-
 Egypt
-
 El Salvador
-
 Estonia
-
 Eswatini
-
 Ethiopia
-
 Finland
-
 France
-
 Georgia
-
 Germany
-
 Ghana
-
 Greece
-
 Haiti
-
 Hong Kong
-
 Hungary
-
 India
-
 Indonesia
-
 Iran, Islamic republic
-
 Iraq
-
 Ireland
-
 Israel
-
 Italy
-
 Jamaica
-
 Japan
-
 Jordan
-
 Kazakhstan
-
 Kenya
-
 Korea
-
 Kuwait
-
 Kyrgyzstan
-
 Laos
-
 Latvia
-
 Lebanon
-
 Lesotho
-
 Libya
-
 Lithuania
-
 Luxembourg
-
 Madagascar
-
 Malaysia
-
 Malta
-
 Mauritius
-
 Mexico
-
 Moldova
-
 Mongolia
-
 Montenegro
-
 Morocco
-
 Mozambique
-
 Myanmar
-
 Namibia
-
 Nepal
-
 Netherlands
-
 New Zealand
-
 Nigeria
-
 North Macedonia
-
 Norway
-
 Oman
-
 Pakistan
-
 Palestine
-
 Panama
-
 Papua New Guinea
-
 Paraguay
-
 Peru
-
 Philippines
-
 Poland
-
 Portugal
-
 Puerto Rico
-
 Qatar
-
 Reunion
-
 Romania
-
 Rwanda
-
 Saudi Arabia
-
 Serbia
-
 Singapore
-
 Slovakia
-
 Slovenia
-
 Somalia
-
 South Africa
-
 Spain
-
 Sri Lanka
-
 Sweden
-
 Switzerland
-
 Syria
-
 Taiwan
-
 Tajikistan
-
 Tanzania
-
 Thailand
-
 Trinidad and Tobago
-
 Tunisia
-
 Turkey
-
 UAE
-
 Uganda
-
 Ukraine
-
 United Kingdom
-
United States
-
 Uruguay
-
 Uzbekistan
-
 Venezuela
-
 Vietnam
-
 Yemen
-
 Zambia
-
 Zimbabwe
- Forex
- Crypto












