

Dividend announcement sees Manulife Financial stock hold steady as consolidation persists

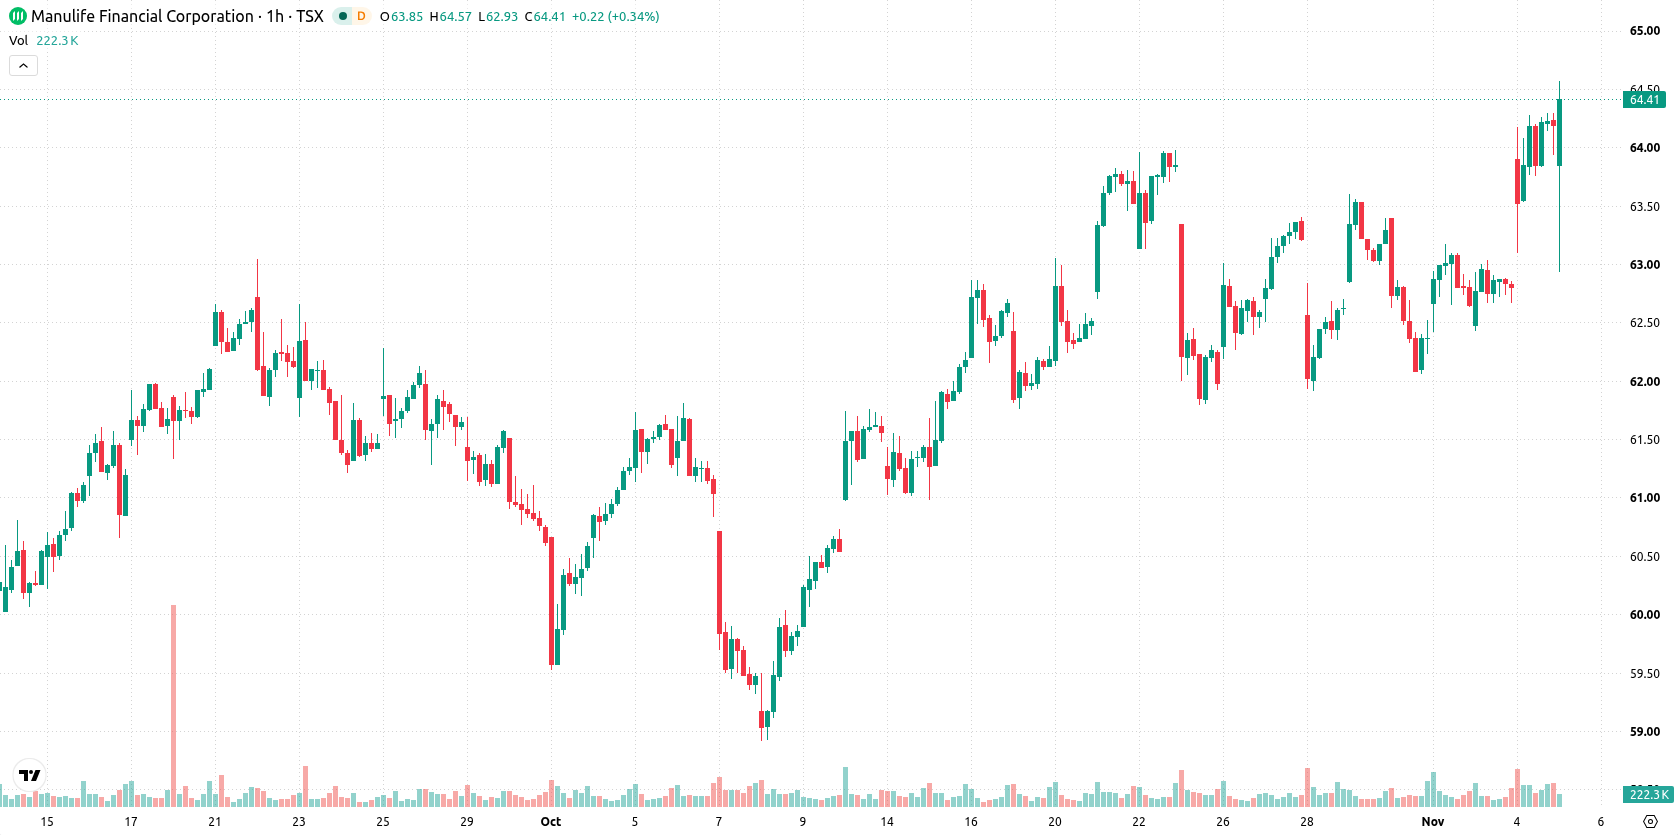
Manulife Financial (MFC) stock is trading at C$64.12 after a modest decline during the session. The price remains above its key short- and medium-term moving averages, highlighting a constructive near-term setup.
 63.11
63.65
Highlights
- Manulife Financial core earnings rose 4% year over year to $2.1 billion in the third quarter of 2026.
- The company declared a quarterly dividend of C$0.48 per share, annualized at 4.2%, with additional preferred dividends confirmed.
- Shares of Manulife Financial closed at C$64.12 and are expected to trade in a C$63.12 to C$65.12 range over the next 2 to 3 days, with technical indicators showing prevailing bullish momentum and only CCI suggesting possible short-term overheating.
Mixed earnings momentum amid net income drop and dividends boost
Manulife Financial reported third-quarter 2026 results, with core earnings rising 4% year over year to $2.1 billion, driven by business momentum in Asia and improved performance from North American insurance, while net income fell $400 million due to asset valuation charges, according to Panabee. The company declared a quarterly dividend of C$0.48 per share, representing an annualized yield of 4.2%, with payment set for December 21, 2026, according to MarketBeat. Additional quarterly dividends on non-cumulative preferred shares were also announced by the Board of Directors, as reported by Aol, providing incremental support for income-focused investors. These updates reflect a mixed but fundamentally active corporate backdrop, though price action has remained under broader selling pressure.
Bullish momentum holds as overbought CCI raises correction risk
On the technical front, MFC is holding above the MA-20 at C$63.26 and MA-50 at C$62.99 on the hourly chart, maintaining a wide margin above the MA-200 at C$55.67 on the daily timeframe. The Ichimoku Kijun sits at C$63.17, offering immediate support. Momentum indicators are mostly constructive: MACD and ADX both point to ongoing buy conditions, while Bull/Bear Power at 0.64 reflects intraday dominance by buyers and Awesome Oscillator aligns with prevailing momentum. However, RSI and Stoch RSI remain neutral, and CCI is now in the overbought zone, suggesting only CCI flags a potential correction risk in the short term.
Consolidation likely as upside potential outweighs limited downside
For the next 2–3 trading days, MFC is expected to trade between C$63.12 and C$65.12, matching its recent volatility range. The forecast probability for a further upside move is 78%, with downside risk seen as comparatively limited. The baseline scenario sees consolidation within this band; a break above C$65.12 could drive further strength, while a slide below C$63.12 would imply a short-term retracement.
Previously it was reported that Manulife Financial was exhibiting technical strength with a constructive outlook supported by a resilient bullish structure. The latest financial results and ongoing technical momentum strengthen this positive view, with traders advised to watch for a decisive move outside the C$63.12–C$65.12 range to signal the next directional leg.






Latest Manulife Financial News




-
 Afghanistan
-
 Albania
-
 Algeria
-
 Angola
-
 Argentina
-
 Armenia
-
 Australia
-
 Austria
-
 Azerbaijan
-
 Bahamas
-
 Bahrain
-
 Bangladesh
-
 Belarus
-
 Belgium
-
 Bolivia
-
 Botswana
-
 Brazil
-
 Brunei
-
 Bulgaria
-
 Cambodia
-
 Cameroon
-
 Canada
-
 Chile
-
 China
-
 Colombia
-
 Congo
-
 Costa Rica
-
 Cote d'Ivoire
-
 Croatia
-
 Cuba
-
 Cyprus
-
 Czechia
-
 DR Congo
-
 Denmark
-
 Dominican Republic
-
 Ecuador
-
 Egypt
-
 El Salvador
-
 Estonia
-
 Eswatini
-
 Ethiopia
-
 Finland
-
 France
-
 Georgia
-
 Germany
-
 Ghana
-
 Greece
-
 Haiti
-
 Hong Kong
-
 Hungary
-
 India
-
 Indonesia
-
 Iran, Islamic republic
-
 Iraq
-
 Ireland
-
 Israel
-
 Italy
-
 Jamaica
-
 Japan
-
 Jordan
-
 Kazakhstan
-
 Kenya
-
 Korea
-
 Kuwait
-
 Kyrgyzstan
-
 Laos
-
 Latvia
-
 Lebanon
-
 Lesotho
-
 Libya
-
 Lithuania
-
 Luxembourg
-
 Madagascar
-
 Malaysia
-
 Malta
-
 Mauritius
-
 Mexico
-
 Moldova
-
 Mongolia
-
 Montenegro
-
 Morocco
-
 Mozambique
-
 Myanmar
-
 Namibia
-
 Nepal
-
 Netherlands
-
 New Zealand
-
 Nigeria
-
 North Macedonia
-
 Norway
-
 Oman
-
 Pakistan
-
 Palestine
-
 Panama
-
 Papua New Guinea
-
 Paraguay
-
 Peru
-
 Philippines
-
 Poland
-
 Portugal
-
 Puerto Rico
-
 Qatar
-
 Reunion
-
 Romania
-
 Rwanda
-
 Saudi Arabia
-
 Serbia
-
 Singapore
-
 Slovakia
-
 Slovenia
-
 Somalia
-
 South Africa
-
 Spain
-
 Sri Lanka
-
 Sweden
-
 Switzerland
-
 Syria
-
 Taiwan
-
 Tajikistan
-
 Tanzania
-
 Thailand
-
 Trinidad and Tobago
-
 Tunisia
-
 Turkey
-
 UAE
-
 Uganda
-
 Ukraine
-
 United Kingdom
-
United States
-
 Uruguay
-
 Uzbekistan
-
 Venezuela
-
 Vietnam
-
 Yemen
-
 Zambia
-
 Zimbabwe
- Forex
- Crypto












