

Texas Instruments stock declines as immediate resistance and downward price move weigh

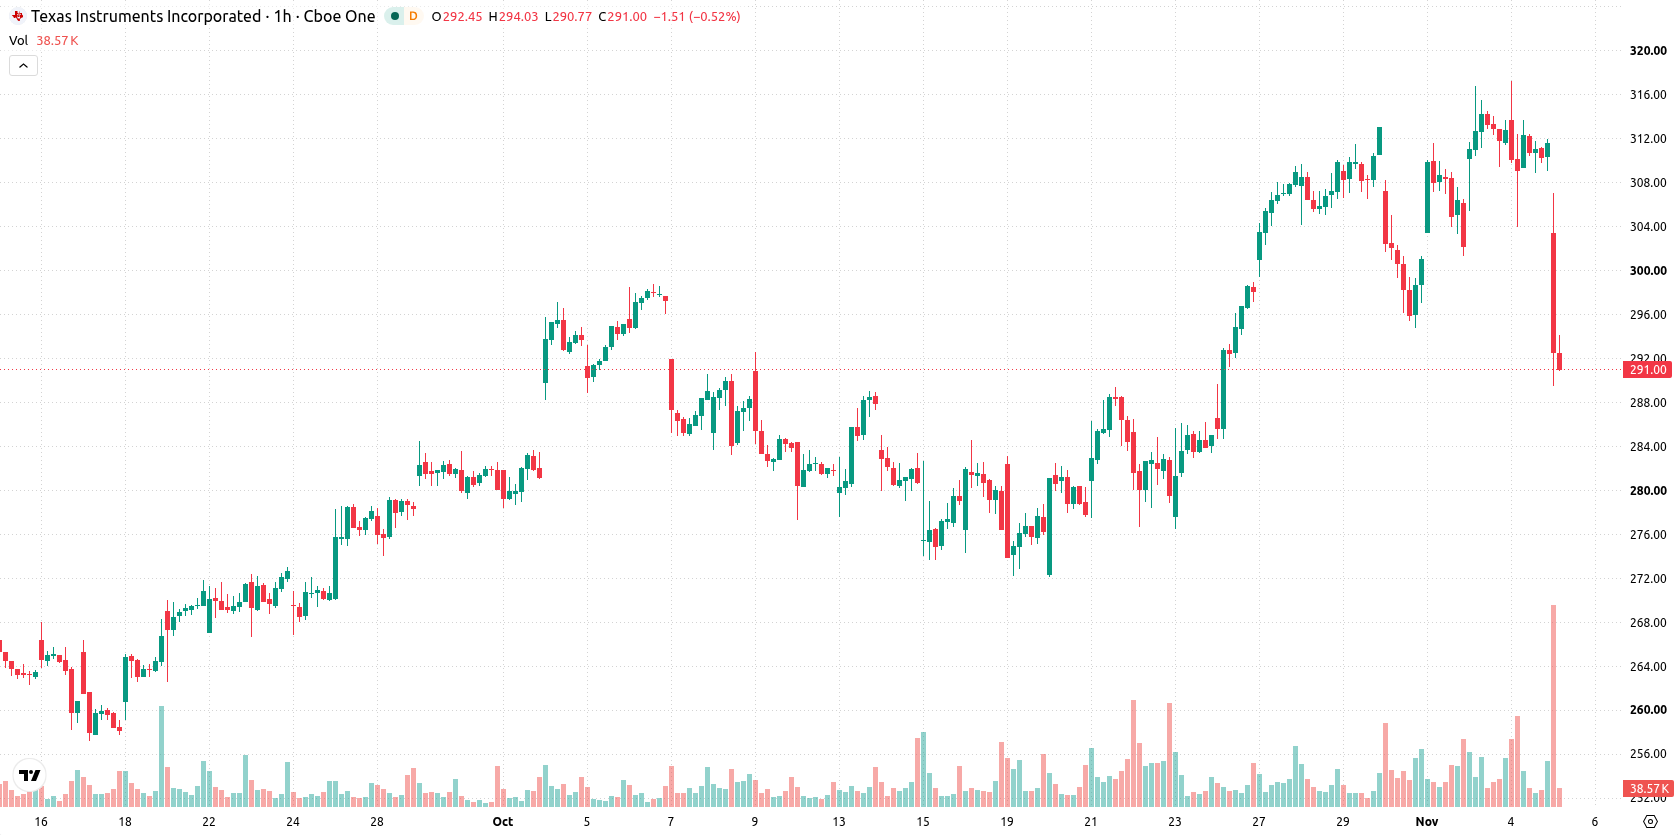
Texas Instruments (TXN) stock is trading at $290.13, marking a decline of 6.86% for the session and positioning the price below its short- and medium-term moving averages, while still holding above long-term levels.
 280.51
316.78
Highlights
- Texas Instruments introduced two Industrial Ethernet devices to simplify integration in factory automation, robotics, and IIoT, expanding its industrial portfolio.
- The new products broaden market reach and support wider automation use cases, setting the stage for increased future demand.
- Shares of Texas Instruments traded down 6.86% to $290.13, with technicals indicating short-term seller pressure but a forecasted range of $280.13 to $316.34 in coming days.
Industrial expansion broadens reach as price responds to selling
Texas Instruments has introduced two new devices that target the simplification of Industrial Ethernet integration within factory automation, robotics, and Industrial Internet of Things applications, expanding its industrial communication portfolio, according to PR Newswire. This product launch broadens the company's market reach and enables its technology to be integrated across a wider range of automation use cases, supporting prospects for future demand. While the expansion signals a strategic effort to strengthen its positioning in industrial electronics, price action has remained under broader selling pressure.
Mixed momentum as resistance caps recovery and key averages breached
On the technical front, TXN is trading below both its MA-20 at $310.08 and MA-50 at $307.44, but remains above the long-term MA-200 at $261.43. The Ichimoku Kijun level at $305.95 is acting as immediate resistance. Momentum indicators present a complex picture: MACD signals Strong Buy, while ADX is Neutral. The RSI stands at 55.51, and the Stoch RSI at 30.94, both indicating neutral momentum. The Commodity Channel Index is also neutral at 20.94. Bull/Bear Power is positive at 1.36, reflecting more active buying on the intraday basis. The Awesome Oscillator is neutral and does not confirm a prevailing trend.
Upward bias persists as wide volatility range shapes risk
In the near term, TXN is forecast to trade within a range of $280.13 to $316.34 amid elevated volatility. The probability of an upward move within this volatility band remains high (over 80%), while downside risk below $280.13 is considered low (less than 20%). The base case calls for price oscillation between these boundaries. A move above $305.95 would open the door for additional gains, while a decline under $280.13 would expose the stock to further weakness.
Previously it was reported that Texas Instruments had entered a period of sustained bullish momentum, supported by technical strength and notable insider and institutional activity. The current article signals a shift in the technical landscape, with downside pressure dominating the short- and medium-term trends, making the $305.95 resistance level a critical threshold for potential recovery in the sessions ahead.






Latest Texas Instruments News




-
 Afghanistan
-
 Albania
-
 Algeria
-
 Angola
-
 Argentina
-
 Armenia
-
 Australia
-
 Austria
-
 Azerbaijan
-
 Bahamas
-
 Bahrain
-
 Bangladesh
-
 Belarus
-
 Belgium
-
 Bolivia
-
 Botswana
-
 Brazil
-
 Brunei
-
 Bulgaria
-
 Cambodia
-
 Cameroon
-
 Canada
-
 Chile
-
 China
-
 Colombia
-
 Congo
-
 Costa Rica
-
 Cote d'Ivoire
-
 Croatia
-
 Cuba
-
 Cyprus
-
 Czechia
-
 DR Congo
-
 Denmark
-
 Dominican Republic
-
 Ecuador
-
 Egypt
-
 El Salvador
-
 Estonia
-
 Eswatini
-
 Ethiopia
-
 Finland
-
 France
-
 Georgia
-
 Germany
-
 Ghana
-
 Greece
-
 Haiti
-
 Hong Kong
-
 Hungary
-
 India
-
 Indonesia
-
 Iran, Islamic republic
-
 Iraq
-
 Ireland
-
 Israel
-
 Italy
-
 Jamaica
-
 Japan
-
 Jordan
-
 Kazakhstan
-
 Kenya
-
 Korea
-
 Kuwait
-
 Kyrgyzstan
-
 Laos
-
 Latvia
-
 Lebanon
-
 Lesotho
-
 Libya
-
 Lithuania
-
 Luxembourg
-
 Madagascar
-
 Malaysia
-
 Malta
-
 Mauritius
-
 Mexico
-
 Moldova
-
 Mongolia
-
 Montenegro
-
 Morocco
-
 Mozambique
-
 Myanmar
-
 Namibia
-
 Nepal
-
 Netherlands
-
 New Zealand
-
 Nigeria
-
 North Macedonia
-
 Norway
-
 Oman
-
 Pakistan
-
 Palestine
-
 Panama
-
 Papua New Guinea
-
 Paraguay
-
 Peru
-
 Philippines
-
 Poland
-
 Portugal
-
 Puerto Rico
-
 Qatar
-
 Reunion
-
 Romania
-
 Rwanda
-
 Saudi Arabia
-
 Serbia
-
 Singapore
-
 Slovakia
-
 Slovenia
-
 Somalia
-
 South Africa
-
 Spain
-
 Sri Lanka
-
 Sweden
-
 Switzerland
-
 Syria
-
 Taiwan
-
 Tajikistan
-
 Tanzania
-
 Thailand
-
 Trinidad and Tobago
-
 Tunisia
-
 Turkey
-
 UAE
-
 Uganda
-
 Ukraine
-
 United Kingdom
-
United States
-
 Uruguay
-
 Uzbekistan
-
 Venezuela
-
 Vietnam
-
 Yemen
-
 Zambia
-
 Zimbabwe
- Forex
- Crypto












