

Broadcom stock falls amid selling momentum and friction in VMware business transition

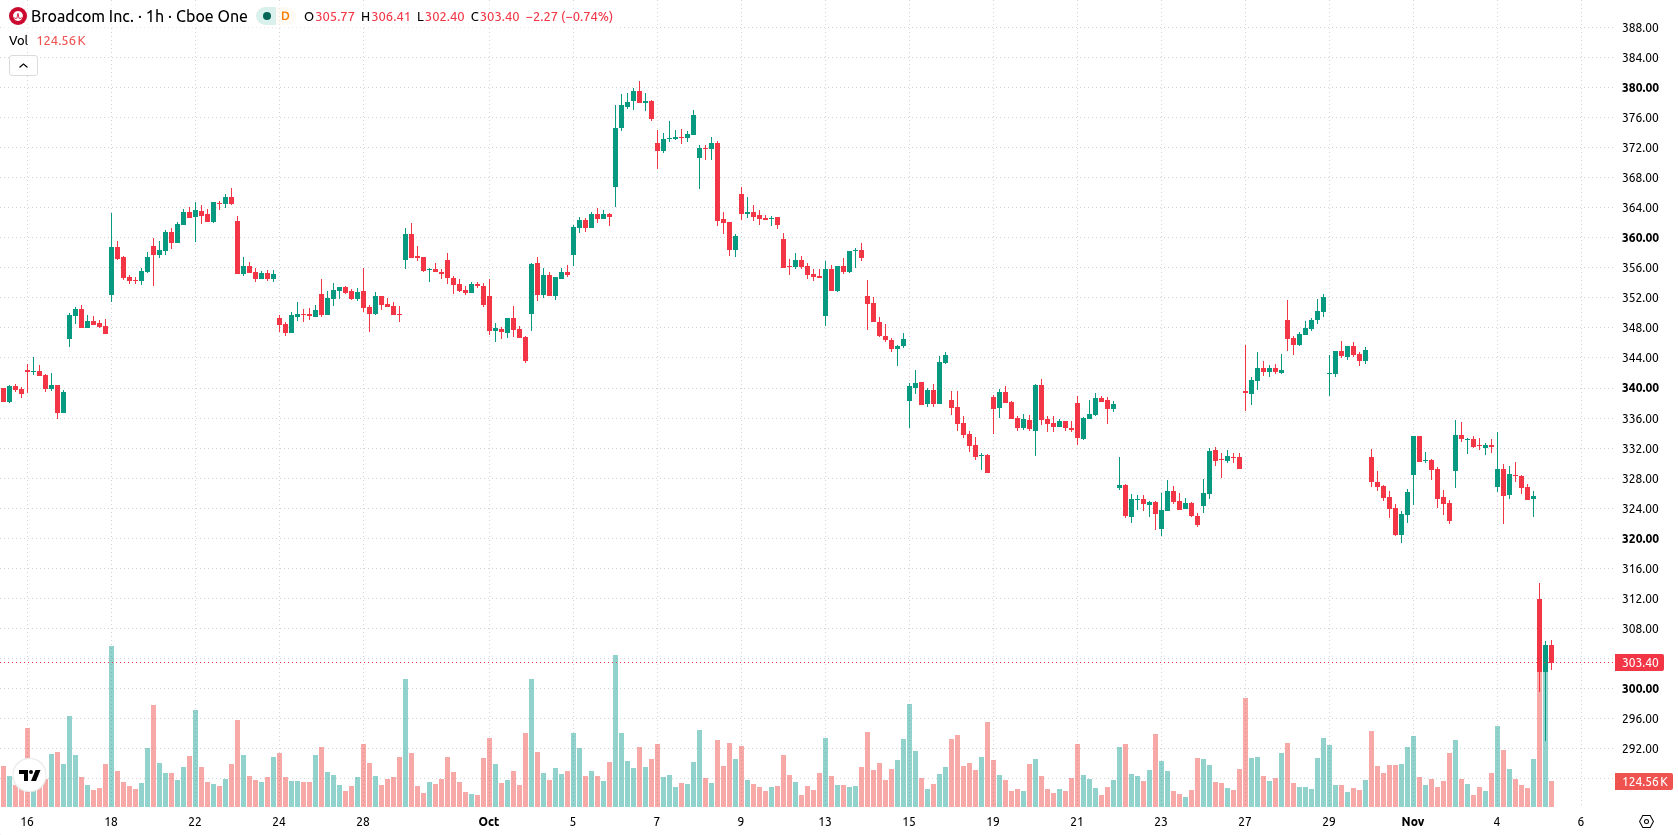
Broadcom (AVGO) stock is trading at $300.46, down 7.69% on the day. The price sits below its short- and long-term moving averages, signaling pronounced weakness versus recent benchmarks.
 311.52
335.17
Highlights
- Broadcom reported annual revenue of $63.89 billion and net profit of $23.13 billion, confirming strong profitability.
- Operational challenges during the VMware business transition are increasing execution risk and could impede synergy realization.
- Shares of Broadcom are under strong selling pressure, trading below key moving averages with a bearish trend and forecast downside to $293.13 to $307.79.
Strong profits offset by execution risk amid VMware transition
Broadcom reported annual revenue of $63.89 billion and net profit of $23.13 billion, reflecting strong operational results and confirming its leading position in the sector. However, ongoing friction during its transition of the VMware business, as reported by TradingKey, suggests operational hurdles that could increase execution risk and limit the realization of expected synergies. Together, these developments frame the current environment as one of robust profitability with lingering structural uncertainty.
Oversold momentum raises rebound odds despite strong sell bias
On the technical front, AVGO is trading below the MA-20 at $327.99 and the MA-50 at $334.75 on the hourly chart, and remains below the MA-200 at $367.39 on the daily timeframe. The immediate resistance is at the Ichimoku Kijun level of $322.04. Momentum analysis shows MACD and ADX both signal a sell bias. RSI is oversold at 25.46, Stochastic RSI is deeply oversold at 0, and CCI is at an extreme -320.22, suggesting selling exhaustion. Bull/Bear Power at -11.75 indicates sellers dominate intraday action, while Awesome Oscillator is neutral and does not confirm the trend. The convergence of oversold readings across RSI, Stochastic RSI, and CCI points to the potential for a short-term rebound despite continued trends favoring sellers.
Downside risk prevails as volatility bands constrain outlook
Short-term expectations point to elevated downside risk, with the projected trading range between $293.13 and $307.79 as the current volatility band. The probability of further declines remains very high, with a rebound seen as low likelihood in the near term. Consolidation within this range is possible if momentum stabilizes; a sustained move above $322.04 would signal a shift to a bullish scenario, while a drop below $293.13 could prompt additional selling pressure.
Earlier, analysts noted that Broadcom was under sustained downside pressure despite growth in its AI business and efforts at technical consolidation. The current article strengthens this bearish outlook with new evidence of pronounced weakness across key momentum and oscillator indicators, highlighting $322.04 as the key resistance level to watch for any potential shift in the prevailing downtrend.









-
 Afghanistan
-
 Albania
-
 Algeria
-
 Angola
-
 Argentina
-
 Armenia
-
 Australia
-
 Austria
-
 Azerbaijan
-
 Bahamas
-
 Bahrain
-
 Bangladesh
-
 Belarus
-
 Belgium
-
 Bolivia
-
 Botswana
-
 Brazil
-
 Brunei
-
 Bulgaria
-
 Cambodia
-
 Cameroon
-
 Canada
-
 Chile
-
 China
-
 Colombia
-
 Congo
-
 Costa Rica
-
 Cote d'Ivoire
-
 Croatia
-
 Cuba
-
 Cyprus
-
 Czechia
-
 DR Congo
-
 Denmark
-
 Dominican Republic
-
 Ecuador
-
 Egypt
-
 El Salvador
-
 Estonia
-
 Eswatini
-
 Ethiopia
-
 Finland
-
 France
-
 Georgia
-
 Germany
-
 Ghana
-
 Greece
-
 Haiti
-
 Hong Kong
-
 Hungary
-
 India
-
 Indonesia
-
 Iran, Islamic republic
-
 Iraq
-
 Ireland
-
 Israel
-
 Italy
-
 Jamaica
-
 Japan
-
 Jordan
-
 Kazakhstan
-
 Kenya
-
 Korea
-
 Kuwait
-
 Kyrgyzstan
-
 Laos
-
 Latvia
-
 Lebanon
-
 Lesotho
-
 Libya
-
 Lithuania
-
 Luxembourg
-
 Madagascar
-
 Malaysia
-
 Malta
-
 Mauritius
-
 Mexico
-
 Moldova
-
 Mongolia
-
 Montenegro
-
 Morocco
-
 Mozambique
-
 Myanmar
-
 Namibia
-
 Nepal
-
 Netherlands
-
 New Zealand
-
 Nigeria
-
 North Macedonia
-
 Norway
-
 Oman
-
 Pakistan
-
 Palestine
-
 Panama
-
 Papua New Guinea
-
 Paraguay
-
 Peru
-
 Philippines
-
 Poland
-
 Portugal
-
 Puerto Rico
-
 Qatar
-
 Reunion
-
 Romania
-
 Rwanda
-
 Saudi Arabia
-
 Serbia
-
 Singapore
-
 Slovakia
-
 Slovenia
-
 Somalia
-
 South Africa
-
 Spain
-
 Sri Lanka
-
 Sweden
-
 Switzerland
-
 Syria
-
 Taiwan
-
 Tajikistan
-
 Tanzania
-
 Thailand
-
 Trinidad and Tobago
-
 Tunisia
-
 Turkey
-
 UAE
-
 Uganda
-
 Ukraine
-
 United Kingdom
-
United States
-
 Uruguay
-
 Uzbekistan
-
 Venezuela
-
 Vietnam
-
 Yemen
-
 Zambia
-
 Zimbabwe
- Forex
- Crypto












