

Broadcom stock weekly forecast: recovery attempts capped by resistance zone with momentum still negative

Shares of Broadcom Inc. (AVGO) are trading near $325, holding just above key support as the week begins. Despite a relatively quiet move last week, the ongoing struggle to stabilize keeps attention on whether support levels will hold or give way in the coming days.
 314.00
335.17
Highlights
- Shares of Broadcom traded at $325 and stayed below major daily moving averages over the past week.
- Technical momentum remains negative, with MACD and oscillators showing persistent weakness and no extreme signals.
- Projected trading range for the coming week is $313.02 to $337.24 with immediate support at $319.36 and resistance at $339.
AI revenue gains and new offerings offset by ETF outflows this week
Broadcom reported continued rapid growth in its AI chip revenue, with management raising fiscal Q4 revenue guidance to $34.8 billion, according to 24/7 Wall St. Columbia Bank increased its holdings in AVGO during the third quarter, as noted by MarketBeat, while ETFs saw a net selloff of $164.2 million in AVGO shares on Thursday according to Yahoo Finance. The company also launched new AI security offerings and updated its VMware portfolio for improved private AI cloud deployments, as reported by Yahoo Finance and VMware's official blog. In addition, Broadcom was named as a major provider of AI accelerators for Meta's expanded data center investments and featured in Anthropic's IPO filings.
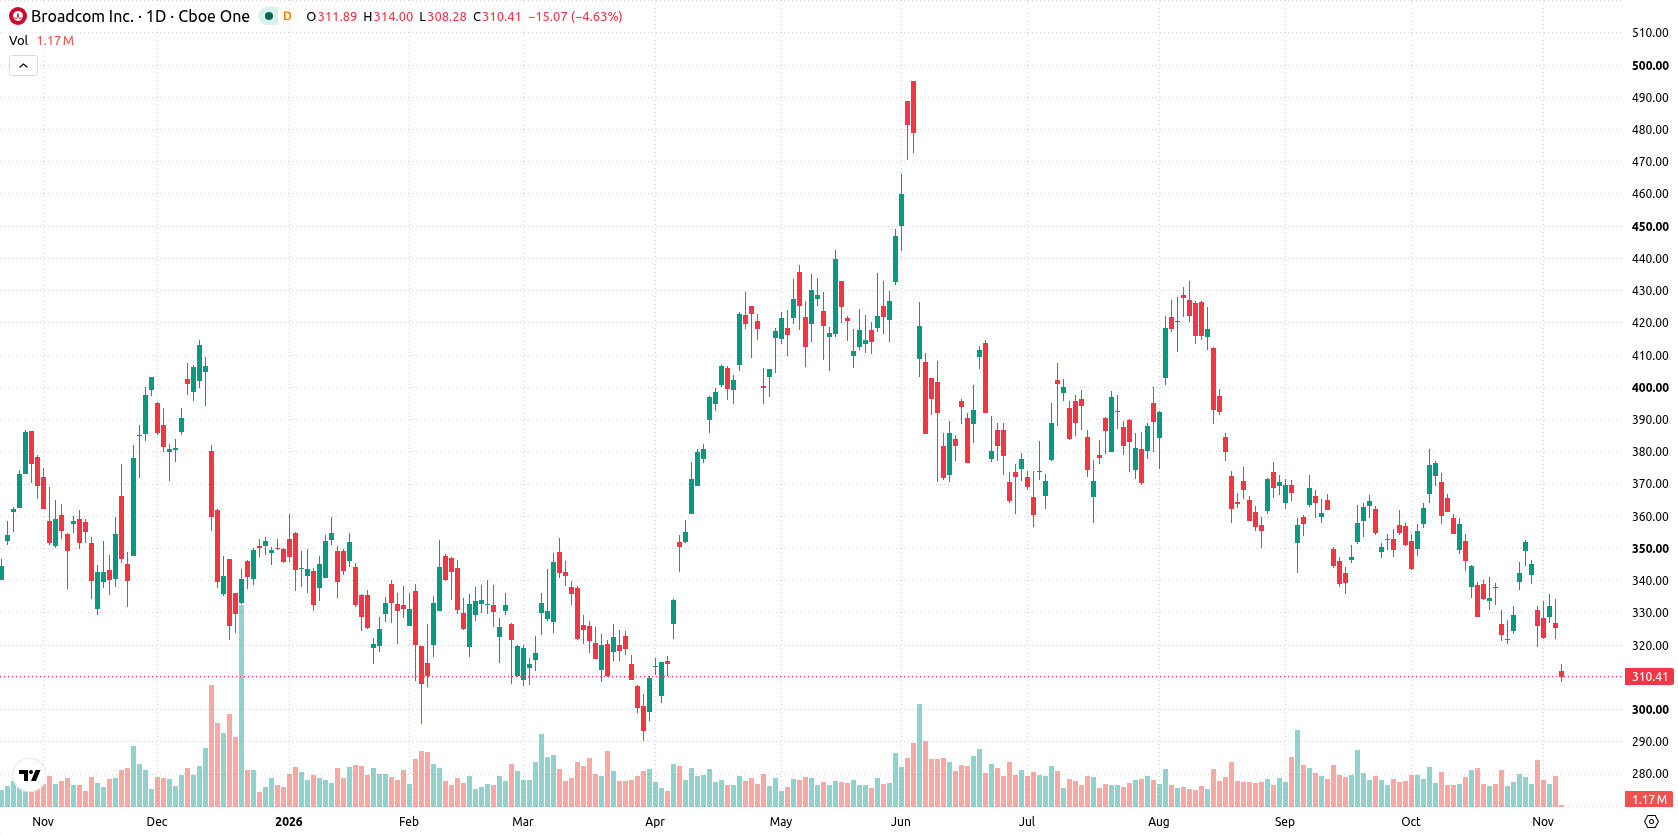
Bearish momentum persists as MACD and oscillators underscore weakness
On the daily chart, the structure shows continued weakness, with MACD and the Awesome Oscillator both signaling sell and confirming the negative bias. All level-based oscillators, including RSI at 41.91, remain in their neutral zones, offering no extreme signals. Volatility has been notable at 8.39% over the past week, and the momentum character is defined by a sharp move lower without a sustained trend. Immediate support is at $319.36, with resistance anchored at the 20-day average of $339 and additional resistance near the Ichimoku Kijun at $350.08.
Further downside risk prevails as support break looms next week
For the coming trading week, the expected range is $313.02 to $337.24. There is a very high probability of a further decrease and a very low probability of an increase. The base case is continued trading between $319.36 and $339. If price breaks above $339, a test of the Kijun at $350.08 may follow. Should support at $319.36 give way, the stock could move toward the lower end of the projected range.
Earlier, analysts noted that Broadcom remained under sustained downside pressure despite strength in AI-related business segments and ongoing technical consolidation. The current analysis underscores this caution, with traders advised to monitor the $319.36 support for a potential breakdown as the next key risk.









-
 Afghanistan
-
 Albania
-
 Algeria
-
 Angola
-
 Argentina
-
 Armenia
-
 Australia
-
 Austria
-
 Azerbaijan
-
 Bahamas
-
 Bahrain
-
 Bangladesh
-
 Belarus
-
 Belgium
-
 Bolivia
-
 Botswana
-
 Brazil
-
 Brunei
-
 Bulgaria
-
 Cambodia
-
 Cameroon
-
 Canada
-
 Chile
-
 China
-
 Colombia
-
 Congo
-
 Costa Rica
-
 Cote d'Ivoire
-
 Croatia
-
 Cuba
-
 Cyprus
-
 Czechia
-
 DR Congo
-
 Denmark
-
 Dominican Republic
-
 Ecuador
-
 Egypt
-
 El Salvador
-
 Estonia
-
 Eswatini
-
 Ethiopia
-
 Finland
-
 France
-
 Georgia
-
 Germany
-
 Ghana
-
 Greece
-
 Haiti
-
 Hong Kong
-
 Hungary
-
 India
-
 Indonesia
-
 Iran, Islamic republic
-
 Iraq
-
 Ireland
-
 Israel
-
 Italy
-
 Jamaica
-
 Japan
-
 Jordan
-
 Kazakhstan
-
 Kenya
-
 Korea
-
 Kuwait
-
 Kyrgyzstan
-
 Laos
-
 Latvia
-
 Lebanon
-
 Lesotho
-
 Libya
-
 Lithuania
-
 Luxembourg
-
 Madagascar
-
 Malaysia
-
 Malta
-
 Mauritius
-
 Mexico
-
 Moldova
-
 Mongolia
-
 Montenegro
-
 Morocco
-
 Mozambique
-
 Myanmar
-
 Namibia
-
 Nepal
-
 Netherlands
-
 New Zealand
-
 Nigeria
-
 North Macedonia
-
 Norway
-
 Oman
-
 Pakistan
-
 Palestine
-
 Panama
-
 Papua New Guinea
-
 Paraguay
-
 Peru
-
 Philippines
-
 Poland
-
 Portugal
-
 Puerto Rico
-
 Qatar
-
 Reunion
-
 Romania
-
 Rwanda
-
 Saudi Arabia
-
 Serbia
-
 Singapore
-
 Slovakia
-
 Slovenia
-
 Somalia
-
 South Africa
-
 Spain
-
 Sri Lanka
-
 Sweden
-
 Switzerland
-
 Syria
-
 Taiwan
-
 Tajikistan
-
 Tanzania
-
 Thailand
-
 Trinidad and Tobago
-
 Tunisia
-
 Turkey
-
 UAE
-
 Uganda
-
 Ukraine
-
 United Kingdom
-
United States
-
 Uruguay
-
 Uzbekistan
-
 Venezuela
-
 Vietnam
-
 Yemen
-
 Zambia
-
 Zimbabwe
- Forex
- Crypto












