

IBKR slides as sellers maintain control over price action

Interactive Brokers (IBKR) stock is trading at $72.45, down 6.97% on the day and hovering near today's low. The price remains below its key moving averages, reflecting ongoing downward momentum.
 78.10
79.57
Highlights
- Interactive Brokers now lets US investors trade stocks and cryptocurrencies directly through X's Cashtags feature.
- This integration is intended to increase user engagement on X and position Interactive Brokers for longer-term client growth.
- Shares of Interactive Brokers fell 6.97% to $72.45, with technical signals indicating strong downward momentum and a projected trading range of $70.25 to $74.65.
User engagement target as Cashtags integration expands X platform access
Interactive Brokers has integrated with X's Cashtags feature, enabling US investors to trade stocks and cryptocurrencies directly from ticker searches on the X platform, according to Investingnews. This development broadens the company's digital ecosystem, potentially increasing engagement among X platform users by streamlining the trading process. The integration may support longer-term client growth, though price action has remained under broader selling pressure.
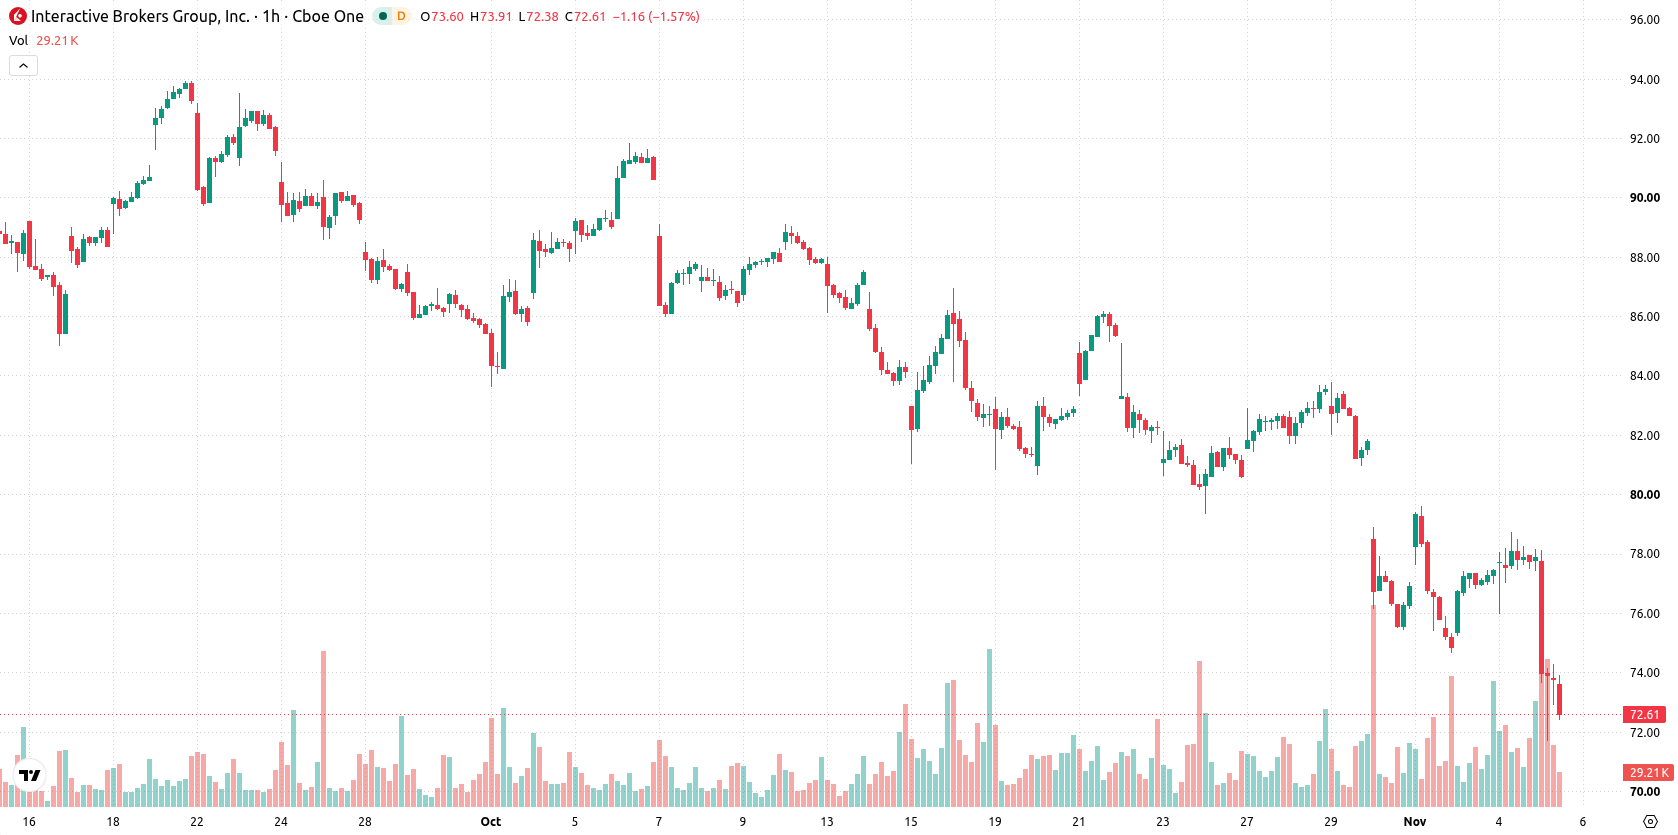
Bearish momentum holds as IBKR tests multiple resistance zones
IBKR is trading below the MA-20 at $76.91 and the MA-50 at $79.29 on the hourly chart, and also remains under the MA-200 at $83.04 on the daily timeframe. The Ichimoku Kijun sits at $76.61, acting as immediate resistance. Momentum indicators are bearish overall, with both MACD and ADX signaling continued selling activity. RSI is neutral, while Stoch RSI and CCI are in the oversold zone. Bull/Bear Power is positive at 1.12, reflecting some intraday buyer attempts despite the broader downside. The Awesome Oscillator is neutral, and price is trading near today's low, indicating strong intraday volatility and seller dominance.
Downside risk persists as technicals limit rebound prospects
In the short term, IBKR is expected to consolidate in a range between $70.25 and $74.65, which reflects the typical volatility band relative to current levels. The probability of an upward move remains very low given the current technical setup, with further decline more likely. If the price breaks above $76.61 resistance, a rebound could be triggered, while a move below $70.25 support may open the way for additional downside pressure.
Previously it was reported that Interactive Brokers' stock was exhibiting continued technical weakness despite ongoing efforts to enhance its platform and broaden its product offerings. The latest integration with X's Cashtags feature adds a new channel for potential client growth, but the prevailing scenario remains cautious, with traders advised to monitor $70.25 as a key level that could signal further downside if breached.






Latest Interactive Brokers News




-
 Afghanistan
-
 Albania
-
 Algeria
-
 Angola
-
 Argentina
-
 Armenia
-
 Australia
-
 Austria
-
 Azerbaijan
-
 Bahamas
-
 Bahrain
-
 Bangladesh
-
 Belarus
-
 Belgium
-
 Bolivia
-
 Botswana
-
 Brazil
-
 Brunei
-
 Bulgaria
-
 Cambodia
-
 Cameroon
-
 Canada
-
 Chile
-
 China
-
 Colombia
-
 Congo
-
 Costa Rica
-
 Cote d'Ivoire
-
 Croatia
-
 Cuba
-
 Cyprus
-
 Czechia
-
 DR Congo
-
 Denmark
-
 Dominican Republic
-
 Ecuador
-
 Egypt
-
 El Salvador
-
 Estonia
-
 Eswatini
-
 Ethiopia
-
 Finland
-
 France
-
 Georgia
-
 Germany
-
 Ghana
-
 Greece
-
 Haiti
-
 Hong Kong
-
 Hungary
-
 India
-
 Indonesia
-
 Iran, Islamic republic
-
 Iraq
-
 Ireland
-
 Israel
-
 Italy
-
 Jamaica
-
 Japan
-
 Jordan
-
 Kazakhstan
-
 Kenya
-
 Korea
-
 Kuwait
-
 Kyrgyzstan
-
 Laos
-
 Latvia
-
 Lebanon
-
 Lesotho
-
 Libya
-
 Lithuania
-
 Luxembourg
-
 Madagascar
-
 Malaysia
-
 Malta
-
 Mauritius
-
 Mexico
-
 Moldova
-
 Mongolia
-
 Montenegro
-
 Morocco
-
 Mozambique
-
 Myanmar
-
 Namibia
-
 Nepal
-
 Netherlands
-
 New Zealand
-
 Nigeria
-
 North Macedonia
-
 Norway
-
 Oman
-
 Pakistan
-
 Palestine
-
 Panama
-
 Papua New Guinea
-
 Paraguay
-
 Peru
-
 Philippines
-
 Poland
-
 Portugal
-
 Puerto Rico
-
 Qatar
-
 Reunion
-
 Romania
-
 Rwanda
-
 Saudi Arabia
-
 Serbia
-
 Singapore
-
 Slovakia
-
 Slovenia
-
 Somalia
-
 South Africa
-
 Spain
-
 Sri Lanka
-
 Sweden
-
 Switzerland
-
 Syria
-
 Taiwan
-
 Tajikistan
-
 Tanzania
-
 Thailand
-
 Trinidad and Tobago
-
 Tunisia
-
 Turkey
-
 UAE
-
 Uganda
-
 Ukraine
-
 United Kingdom
-
United States
-
 Uruguay
-
 Uzbekistan
-
 Venezuela
-
 Vietnam
-
 Yemen
-
 Zambia
-
 Zimbabwe
- Forex
- Crypto












