

Interactive Brokers stock advances as upward price move follows rise in client equity

Interactive Brokers Group (IBKR) stock is trading at $77.35, marking a daily gain of 3.37%. The price remains below its key moving averages, indicating recent gains occurred within a broader context of lagging trend signals.
 77.40
83.62
Highlights
- Interactive Brokers Group saw daily average revenue trades fall 4% year over year in October 2026 to 4.306 million.
- Ending client equity at Interactive Brokers Group grew 19% year over year to $928.6 billion, indicating a larger client asset base.
- IBKR/USD trades below key moving averages with bearish momentum signals and an expected range of $73.33 to $81.37.
Rising client assets offsetting transaction revenue pressures amid volume decline
Interactive Brokers Group reported a 4% year-over-year decline in daily average revenue trades for October 2026, falling to 4.306 million, according to TradingView. This drop in trading activity may signal softer transaction-driven revenues, yet the company also saw its ending client equity increase 19% over the same period to $928.6 billion, highlighting inflows and a growing client asset base. The combination of lower trade volumes and rising client balances suggests an evolving business mix and may reflect changing client engagement patterns.
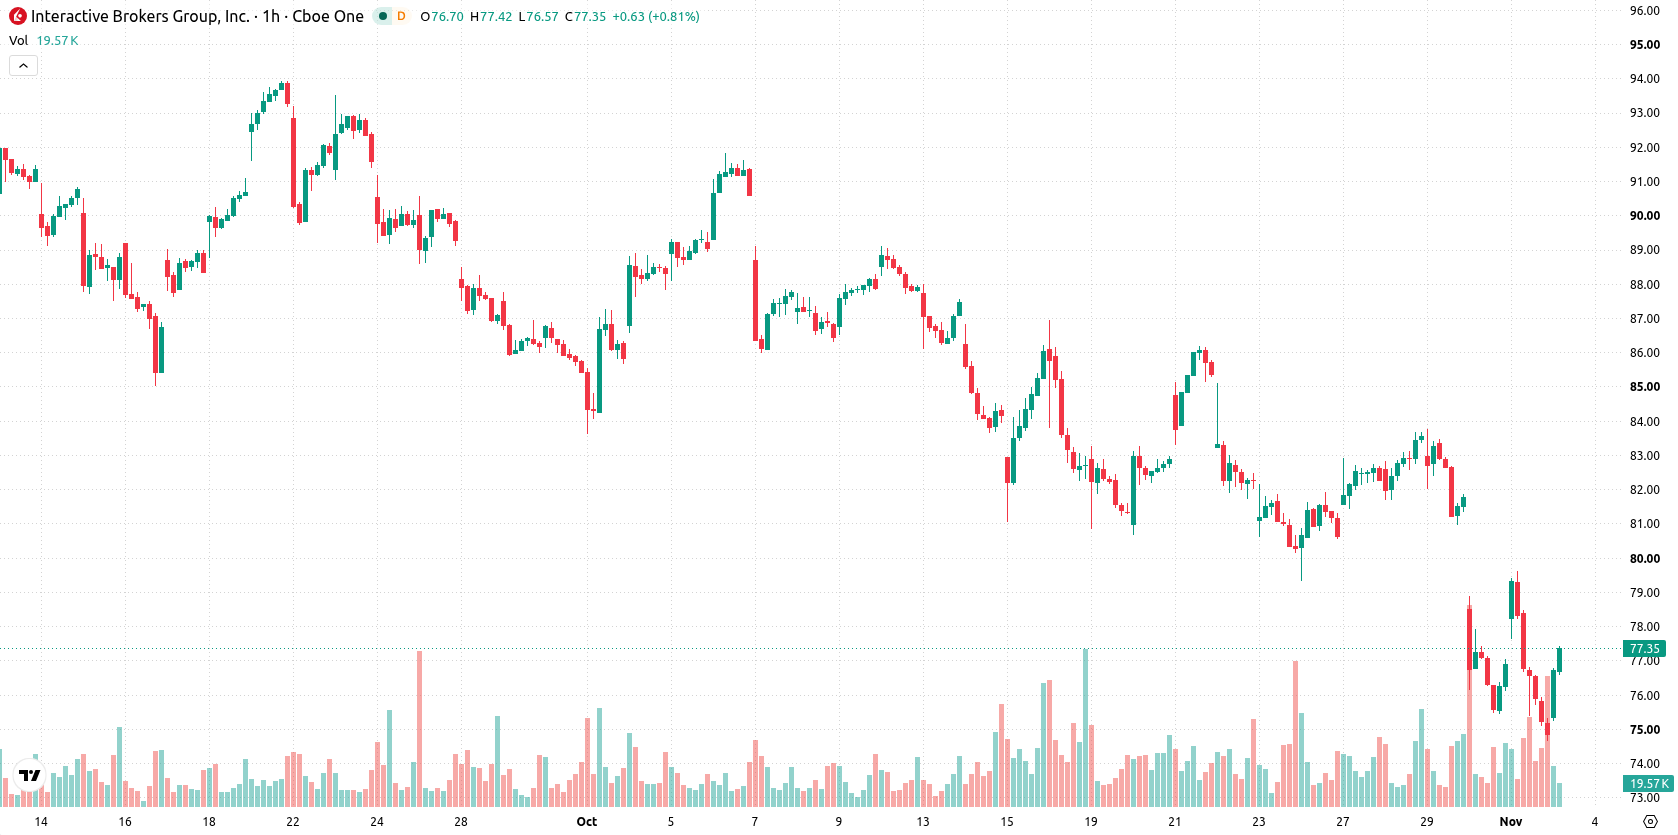
Persistent sell momentum as technical barriers cap short-term upside
IBKR is currently positioned below the MA-20, MA-50, and MA-200 on the H1 timeframe, with the Ichimoku Kijun level established at $79.2 as immediate resistance. Momentum indicators, including both MACD and ADX, remain in sell mode, indicating persistent selling pressure at multiple timeframes. RSI, Stoch RSI, and CCI are all in neutral territory, providing no clear overbought or oversold signals. Bull/Bear Power is at –0.21, reflecting slight seller dominance, while the Awesome Oscillator confirms this bias with readings consistent with a bearish tone.
Downside favored as price consolidates within defined volatility band
Over the upcoming sessions, IBKR is likely to trade within a volatility band between $73.33 and $81.37. The probability of an upward move is currently estimated at 36%, while a decline is more probable at 64%. The baseline expectation is for the stock to consolidate within this range; a breakout above the $79.2 resistance could open further upside, while a move below $73.33 would expose the stock to additional losses.
Previously it was reported that Interactive Brokers' stock continued to show technical weakness despite new product initiatives aimed at enhancing its platform. Current technical and activity indicators reinforce this cautious outlook, with continued consolidation expected and a decisive move above $79.2 required to shift the prevailing bearish bias.






Latest Interactive Brokers News




-
 Afghanistan
-
 Albania
-
 Algeria
-
 Angola
-
 Argentina
-
 Armenia
-
 Australia
-
 Austria
-
 Azerbaijan
-
 Bahamas
-
 Bahrain
-
 Bangladesh
-
 Belarus
-
 Belgium
-
 Bolivia
-
 Botswana
-
 Brazil
-
 Brunei
-
 Bulgaria
-
 Cambodia
-
 Cameroon
-
 Canada
-
 Chile
-
 China
-
 Colombia
-
 Congo
-
 Costa Rica
-
 Cote d'Ivoire
-
 Croatia
-
 Cuba
-
 Cyprus
-
 Czechia
-
 DR Congo
-
 Denmark
-
 Dominican Republic
-
 Ecuador
-
 Egypt
-
 El Salvador
-
 Estonia
-
 Eswatini
-
 Ethiopia
-
 Finland
-
 France
-
 Georgia
-
 Germany
-
 Ghana
-
 Greece
-
 Haiti
-
 Hong Kong
-
 Hungary
-
 India
-
 Indonesia
-
 Iran, Islamic republic
-
 Iraq
-
 Ireland
-
 Israel
-
 Italy
-
 Jamaica
-
 Japan
-
 Jordan
-
 Kazakhstan
-
 Kenya
-
 Korea
-
 Kuwait
-
 Kyrgyzstan
-
 Laos
-
 Latvia
-
 Lebanon
-
 Lesotho
-
 Libya
-
 Lithuania
-
 Luxembourg
-
 Madagascar
-
 Malaysia
-
 Malta
-
 Mauritius
-
 Mexico
-
 Moldova
-
 Mongolia
-
 Montenegro
-
 Morocco
-
 Mozambique
-
 Myanmar
-
 Namibia
-
 Nepal
-
 Netherlands
-
 New Zealand
-
 Nigeria
-
 North Macedonia
-
 Norway
-
 Oman
-
 Pakistan
-
 Palestine
-
 Panama
-
 Papua New Guinea
-
 Paraguay
-
 Peru
-
 Philippines
-
 Poland
-
 Portugal
-
 Puerto Rico
-
 Qatar
-
 Reunion
-
 Romania
-
 Rwanda
-
 Saudi Arabia
-
 Serbia
-
 Singapore
-
 Slovakia
-
 Slovenia
-
 Somalia
-
 South Africa
-
 Spain
-
 Sri Lanka
-
 Sweden
-
 Switzerland
-
 Syria
-
 Taiwan
-
 Tajikistan
-
 Tanzania
-
 Thailand
-
 Trinidad and Tobago
-
 Tunisia
-
 Turkey
-
 UAE
-
 Uganda
-
 Ukraine
-
 United Kingdom
-
United States
-
 Uruguay
-
 Uzbekistan
-
 Venezuela
-
 Vietnam
-
 Yemen
-
 Zambia
-
 Zimbabwe
- Forex
- Crypto












