

Interactive Brokers stock extends downward move as support pressure builds near $78.72

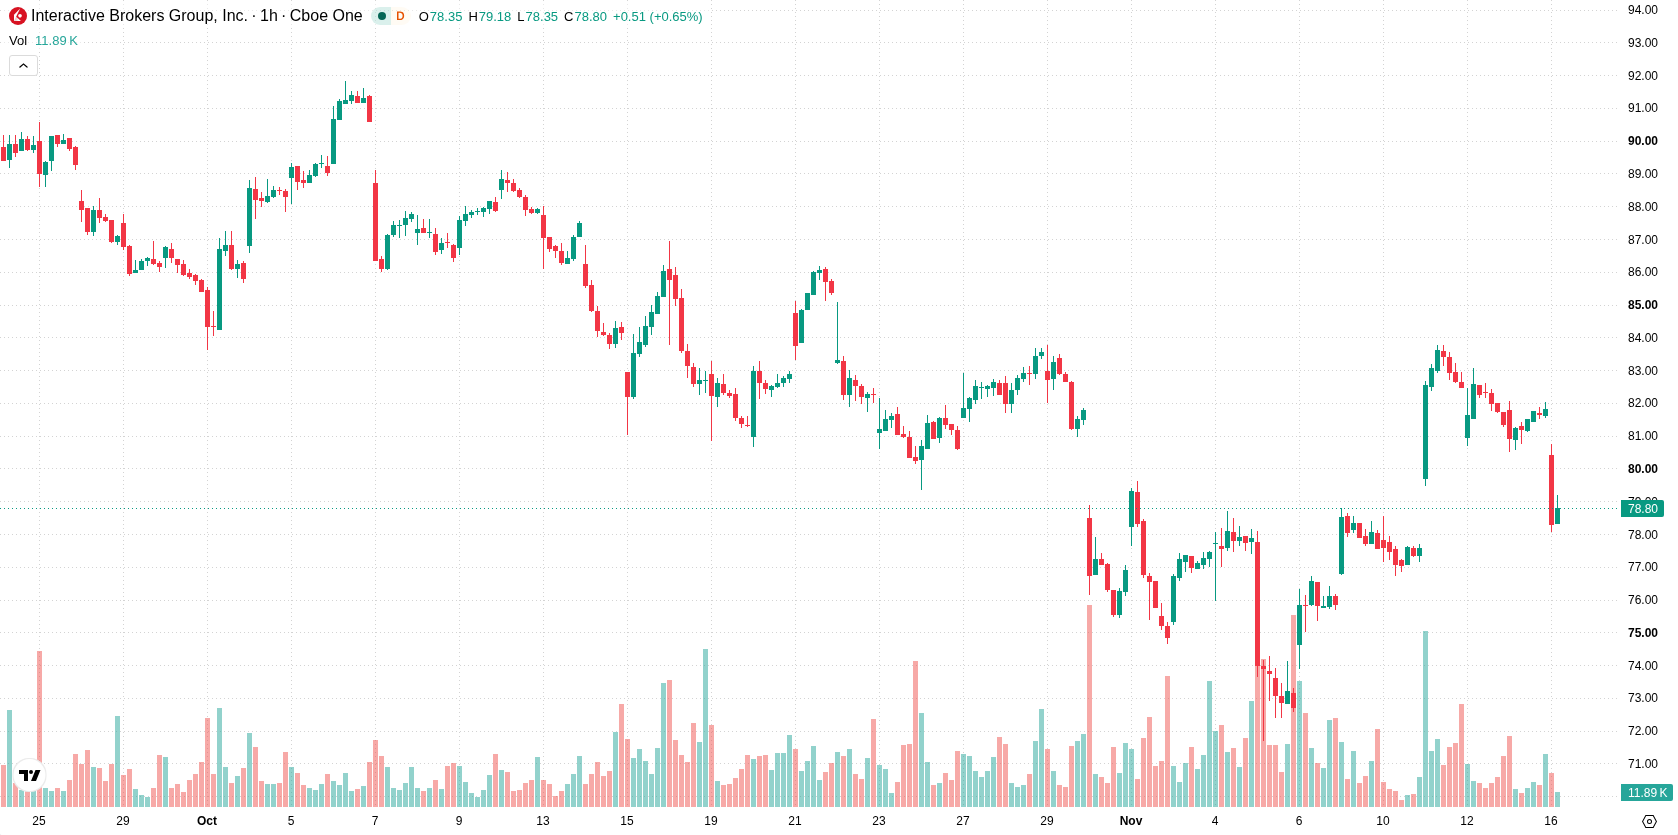
Interactive Brokers (IBKR) stock is trading at $78.84 after a decline of 3.48% for the session. The price sits below its key short-term and long-term moving averages, with some intermediate-term support evident in recent action.
 82.02
83.71
Highlights
- Interactive Brokers has updated its Advisor Portal with new features to broaden platform functionality for electronic trading.
- The incremental upgrade aims to enhance advisor engagement but does not constitute a near-term driver for increased market demand.
- Shares of Interactive Brokers fell 3.48% to $78.84, trading below key moving averages with a forecast range of $75.73 to $82.57 and a higher probability for a downside move.
Incremental platform upgrade met with persistent selling pressure
Interactive Brokers has updated its Advisor Portal as part of ongoing improvements to its electronic trading platform, according to Fxnewsgroup. These enhancements, while expanding platform functionality and potentially supporting future growth in advisor engagement, represent an incremental upgrade rather than an immediate catalyst for broader market demand. Despite the positive operational backdrop, price action has remained under broader selling pressure.
Technical boundaries test amid weak and indecisive momentum
On the H1 timeframe, IBKR trades below the H1 SMA-20 at $82.11 but remains above the H1 SMA-50 at $78.72, while it also sits beneath the D1 SMA-200 at $83.12. The Ichimoku Kijun, acting as immediate resistance, is positioned at $80.25. Among momentum indicators, MACD signals a strong buy, whereas ADX is neutral—suggesting a lack of dominant trend conditions. RSI, Stochastic RSI, and CCI are all neutral, confirming that the price is neither overbought nor oversold. Bull/Bear Power reads at 0.42, indicating modest buyer presence, while the Awesome Oscillator is neutral. Overall, conflicting signals and moderate volatility underscore a weak but indecisive technical setup.
Downside risk prevails as volatility defines near-term range
In the short term, IBKR is expected to trade between $75.73 and $82.57—a volatility band relative to current levels. The probability of an upside breakout stands at 33%, making downside movement more likely in the immediate outlook. Most scenarios favor continued price action within this defined range unless a decisive move through $80.25 resistance or a breakdown below current support skews momentum towards a directional trend.
Previously it was reported that analysts viewed Interactive Brokers' shares as exhibiting near-term stability, supported by technical factors and incremental digital asset product expansion. The current technical setup signals a shift to indecisive and weaker trading conditions, with participants advised to monitor $80.25 as immediate resistance for any change in short-term momentum.






Latest Interactive Brokers News




-
 Afghanistan
-
 Albania
-
 Algeria
-
 Angola
-
 Argentina
-
 Armenia
-
 Australia
-
 Austria
-
 Azerbaijan
-
 Bahamas
-
 Bahrain
-
 Bangladesh
-
 Belarus
-
 Belgium
-
 Bolivia
-
 Botswana
-
 Brazil
-
 Brunei
-
 Bulgaria
-
 Cambodia
-
 Cameroon
-
 Canada
-
 Chile
-
 China
-
 Colombia
-
 Congo
-
 Costa Rica
-
 Cote d'Ivoire
-
 Croatia
-
 Cuba
-
 Cyprus
-
 Czechia
-
 DR Congo
-
 Denmark
-
 Dominican Republic
-
 Ecuador
-
 Egypt
-
 El Salvador
-
 Estonia
-
 Eswatini
-
 Ethiopia
-
 Finland
-
 France
-
 Georgia
-
 Germany
-
 Ghana
-
 Greece
-
 Haiti
-
 Hong Kong
-
 Hungary
-
 India
-
 Indonesia
-
 Iran, Islamic republic
-
 Iraq
-
 Ireland
-
 Israel
-
 Italy
-
 Jamaica
-
 Japan
-
 Jordan
-
 Kazakhstan
-
 Kenya
-
 Korea
-
 Kuwait
-
 Kyrgyzstan
-
 Laos
-
 Latvia
-
 Lebanon
-
 Lesotho
-
 Libya
-
 Lithuania
-
 Luxembourg
-
 Madagascar
-
 Malaysia
-
 Malta
-
 Mauritius
-
 Mexico
-
 Moldova
-
 Mongolia
-
 Montenegro
-
 Morocco
-
 Mozambique
-
 Myanmar
-
 Namibia
-
 Nepal
-
 Netherlands
-
 New Zealand
-
 Nigeria
-
 North Macedonia
-
 Norway
-
 Oman
-
 Pakistan
-
 Palestine
-
 Panama
-
 Papua New Guinea
-
 Paraguay
-
 Peru
-
 Philippines
-
 Poland
-
 Portugal
-
 Puerto Rico
-
 Qatar
-
 Reunion
-
 Romania
-
 Rwanda
-
 Saudi Arabia
-
 Serbia
-
 Singapore
-
 Slovakia
-
 Slovenia
-
 Somalia
-
 South Africa
-
 Spain
-
 Sri Lanka
-
 Sweden
-
 Switzerland
-
 Syria
-
 Taiwan
-
 Tajikistan
-
 Tanzania
-
 Thailand
-
 Trinidad and Tobago
-
 Tunisia
-
 Turkey
-
 UAE
-
 Uganda
-
 Ukraine
-
 United Kingdom
-
United States
-
 Uruguay
-
 Uzbekistan
-
 Venezuela
-
 Vietnam
-
 Yemen
-
 Zambia
-
 Zimbabwe
- Forex
- Crypto












