


Interactive Brokers Group, Inc. (IBKR) stock is trading at $78.31 after gaining 3.2% today. The price currently sits above its key moving averages, suggesting positive near-term momentum.
 77.50
78.64
Highlights
- Allspring Global Investments Holdings LLC raised its position in Interactive Brokers Group by 21.8% during the third quarter, reaching 1,479,094 shares.
- Large fund activity increases demand and liquidity, supporting current positive price momentum for Interactive Brokers stock.
- Interactive Brokers stock trades with short- and medium-term bullish momentum but faces long-term resistance, with projected near-term range between $75.2 and $81.42.
Institutional accumulation supports rally amid renewed fund interest
Allspring Global Investments Holdings LLC increased its stake in Interactive Brokers Group, Inc. by 21.8% in the third quarter, now holding 1,479,094 shares, according to MarketBeat. This substantial institutional purchase adds direct demand and liquidity to the market, which can contribute to upward price momentum. The heightened activity from large funds reflects continued interest from professional investors, offering support for the current positive price action.
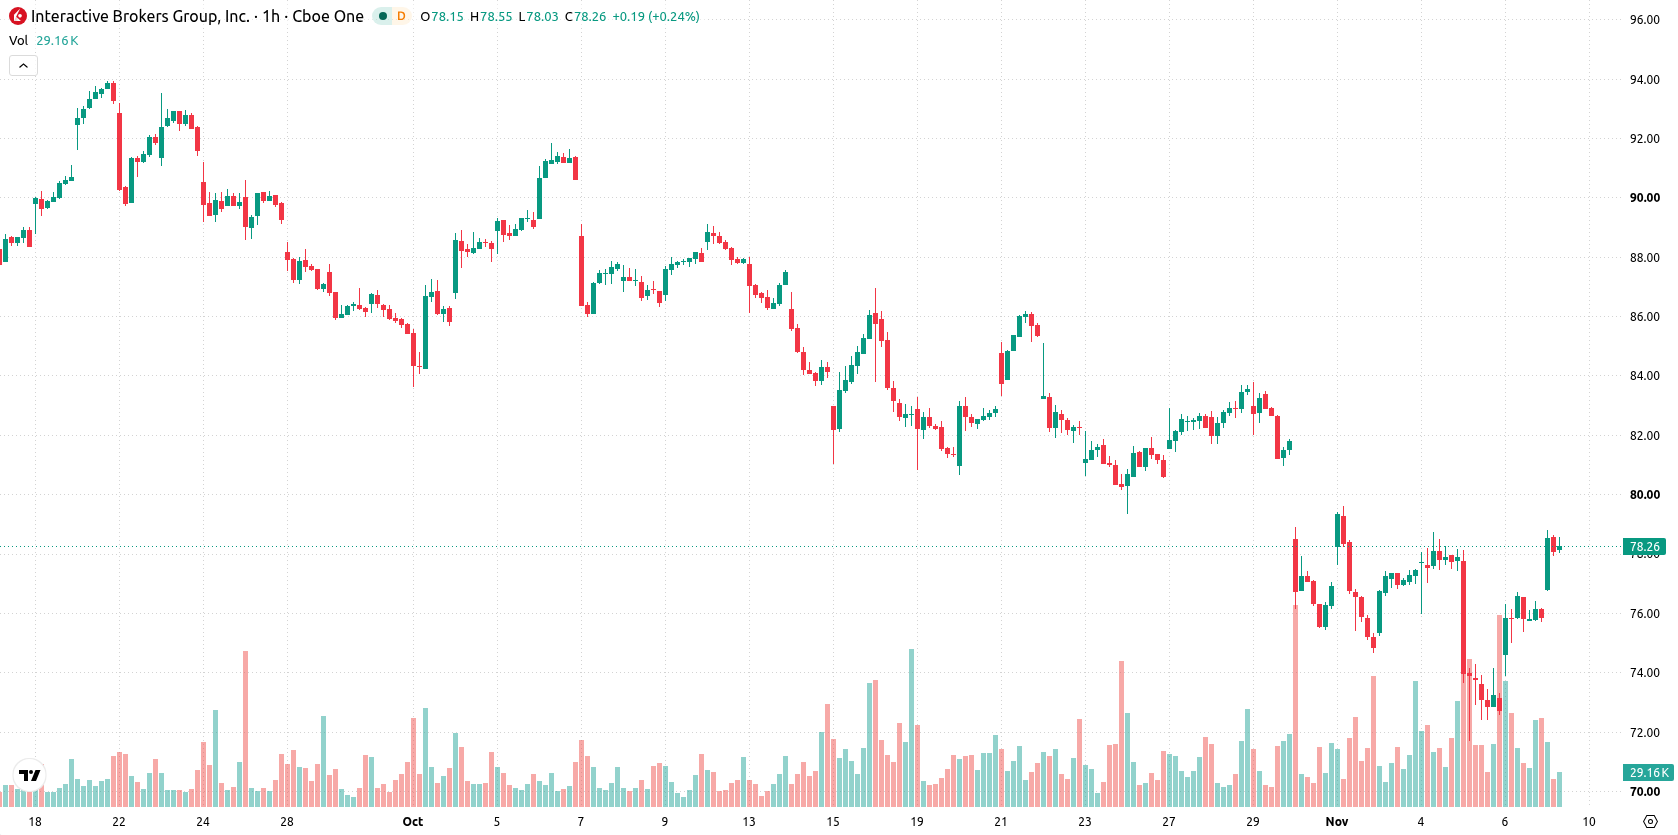
Bullish intraday bias as overbought signals clash with resistance cap
IBKR is trading above its MA-20 at $75.61 and MA-50 at $77.13, while remaining below the MA-200 at $83.02. The Ichimoku Kijun at $75.18 acts as immediate support, and bullish price action remains capped by the next key resistance at $81.42. Technical indicators present a mixed picture: MACD signals a strong sell but ADX remains on a buy, highlighting uncertainty in trend strength. Both the RSI and CCI are neutral, though the Stoch RSI is in overbought territory, suggesting a risk of short-term correction. Bull/Bear Power remains positive at 1.7, indicating continued buyer presence, and the Awesome Oscillator also reflects ongoing bullish momentum intraday. Divergence between overbought Stoch RSI and robust intraday indicators signals a potentially extended move, though a clear reversal does not appear imminent.
Sideways action expected unless breakout triggers further volatility
For the coming sessions, IBKR is likely to fluctuate inside a broad corridor between $75.2 and $81.42, reflecting typical volatility bands relative to current levels. The forecast probability favors a further upward move at 57%, but range-bound trading dominates the baseline scenario. A breakout above $81.42 would activate more bullish targets, while a dip below $75.2 could trigger additional weakness. Unless a decisive technical breach occurs, price action is expected to remain sideways within this established band.
Earlier, analysts noted that Interactive Brokers' shares faced persistent technical pressure despite supporting signs from underlying earnings growth. The current rebound above short-term moving averages, reinforced by increased institutional participation, highlights a shift toward near-term stability, making sustained trading above $75.20 a key level to watch.






Latest Interactive Brokers News




-
 Afghanistan
-
 Albania
-
 Algeria
-
 Angola
-
 Argentina
-
 Armenia
-
 Australia
-
 Austria
-
 Azerbaijan
-
 Bahamas
-
 Bahrain
-
 Bangladesh
-
 Belarus
-
 Belgium
-
 Bolivia
-
 Botswana
-
 Brazil
-
 Brunei
-
 Bulgaria
-
 Cambodia
-
 Cameroon
-
 Canada
-
 Chile
-
 China
-
 Colombia
-
 Congo
-
 Costa Rica
-
 Cote d'Ivoire
-
 Croatia
-
 Cuba
-
 Cyprus
-
 Czechia
-
 DR Congo
-
 Denmark
-
 Dominican Republic
-
 Ecuador
-
 Egypt
-
 El Salvador
-
 Estonia
-
 Eswatini
-
 Ethiopia
-
 Finland
-
 France
-
 Georgia
-
 Germany
-
 Ghana
-
 Greece
-
 Haiti
-
 Hong Kong
-
 Hungary
-
 India
-
 Indonesia
-
 Iran, Islamic republic
-
 Iraq
-
 Ireland
-
 Israel
-
 Italy
-
 Jamaica
-
 Japan
-
 Jordan
-
 Kazakhstan
-
 Kenya
-
 Korea
-
 Kuwait
-
 Kyrgyzstan
-
 Laos
-
 Latvia
-
 Lebanon
-
 Lesotho
-
 Libya
-
 Lithuania
-
 Luxembourg
-
 Madagascar
-
 Malaysia
-
 Malta
-
 Mauritius
-
 Mexico
-
 Moldova
-
 Mongolia
-
 Montenegro
-
 Morocco
-
 Mozambique
-
 Myanmar
-
 Namibia
-
 Nepal
-
 Netherlands
-
 New Zealand
-
 Nigeria
-
 North Macedonia
-
 Norway
-
 Oman
-
 Pakistan
-
 Palestine
-
 Panama
-
 Papua New Guinea
-
 Paraguay
-
 Peru
-
 Philippines
-
 Poland
-
 Portugal
-
 Puerto Rico
-
 Qatar
-
 Reunion
-
 Romania
-
 Rwanda
-
 Saudi Arabia
-
 Serbia
-
 Singapore
-
 Slovakia
-
 Slovenia
-
 Somalia
-
 South Africa
-
 Spain
-
 Sri Lanka
-
 Sweden
-
 Switzerland
-
 Syria
-
 Taiwan
-
 Tajikistan
-
 Tanzania
-
 Thailand
-
 Trinidad and Tobago
-
 Tunisia
-
 Turkey
-
 UAE
-
 Uganda
-
 Ukraine
-
 United Kingdom
-
United States
-
 Uruguay
-
 Uzbekistan
-
 Venezuela
-
 Vietnam
-
 Yemen
-
 Zambia
-
 Zimbabwe
- Forex
- Crypto












