

IBKR rises as recovery attempt follows oversold Stoch RSI conditions

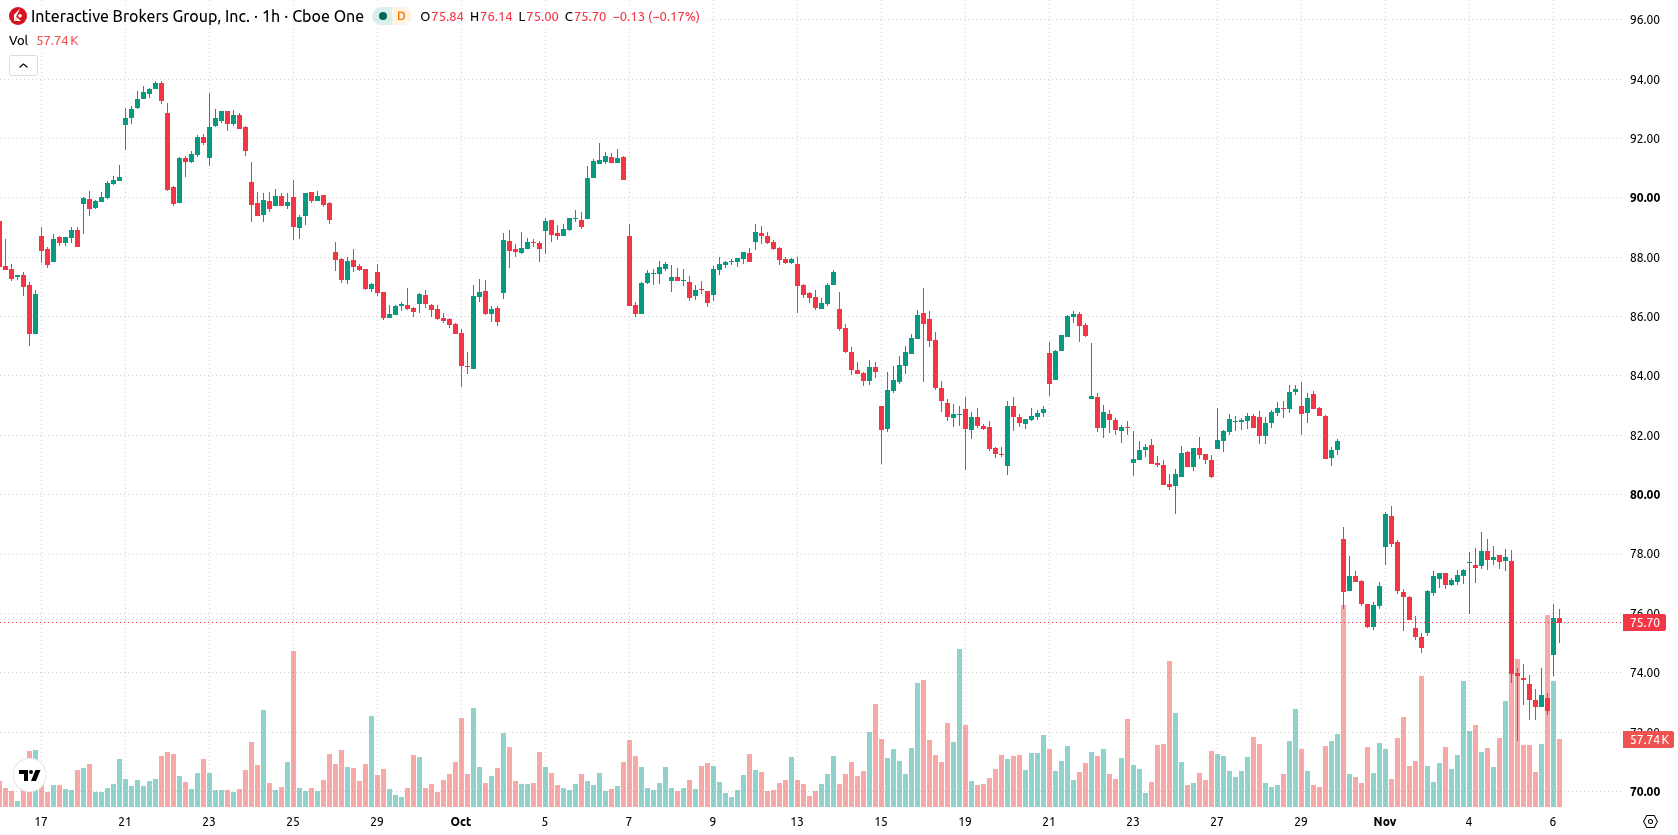
Interactive Brokers (IBKR) stock is trading at $75.92, rising 4.54% on the day. The price is positioned below its key moving averages, reflecting prevailing downward momentum despite today's recovery attempt.
 76.69
79.57
Highlights
- Interactive Brokers reported third quarter 2026 net revenues of $1.91 billion and earnings per share of $0.69.
- Growth in net interest income, commissions, and fees outpaced declines in other income, supporting ongoing business expansion.
- Shares of Interactive Brokers trade below key moving averages with bearish momentum predominating, but broad oversold indicators suggest potential for a rebound as price consolidates in the $72.33 to $79.45 range.
Earnings growth and core revenue gains boost sentiment, spur buying
Interactive Brokers reported net revenues of $1.91 billion and earnings per share of $0.69 for the third quarter of 2026, reflecting business expansion as higher net interest income, commissions, and other fees outpaced declines in other income, according to TradingView. These results demonstrate underlying growth in core revenue streams, highlighting the company's ability to sustain profitability in a changing market environment. The boost to net interest-related earnings and transaction-based income has contributed to positive sentiment around the stock, helping drive recent buying interest.
Bearish momentum persists as sellers dominate amid oversold conditions
IBKR is trading below the MA-20, MA-50, and MA-200, signifying downside pressure over both short- and long-term horizons. The immediate support aligns with the Ichimoku Kijun at $75.18. MACD and ADX both indicate bearish momentum, while RSI, Stochastic RSI, and CCI are all in verified oversold zones—adding potential for a rebound if selling pressure abates. Bull/Bear Power is at -1.45, confirming sellers' dominance intraday, while the Awesome Oscillator remains neutral. The combination of persistent negative momentum signals and broad oversold conditions suggests a phase of mixed, potentially unstable price dynamics.
Range-bound outlook as downside risk outweighs rebound potential
In the short term, IBKR is expected to consolidate within a $72.33 to $79.45 trading range. Statistical scenarios point to a 64% probability of continued downside versus a 36% chance of a rebound. The baseline expectation is for price action to remain choppy inside this volatility band. For any sustained bullish move to unfold, the price would need to break out above the range high; conversely, breach of the noted support would likely extend declines.
Earlier, analysts noted that Interactive Brokers' shares remained under technical pressure despite new platform integrations aimed at driving growth. The latest earnings-driven bounce adds a fundamental dimension to the analysis, and traders should now monitor the $72.33–$79.45 volatility range for potential breakout or breakdown signals in the sessions ahead.






Latest Interactive Brokers News




-
 Afghanistan
-
 Albania
-
 Algeria
-
 Angola
-
 Argentina
-
 Armenia
-
 Australia
-
 Austria
-
 Azerbaijan
-
 Bahamas
-
 Bahrain
-
 Bangladesh
-
 Belarus
-
 Belgium
-
 Bolivia
-
 Botswana
-
 Brazil
-
 Brunei
-
 Bulgaria
-
 Cambodia
-
 Cameroon
-
 Canada
-
 Chile
-
 China
-
 Colombia
-
 Congo
-
 Costa Rica
-
 Cote d'Ivoire
-
 Croatia
-
 Cuba
-
 Cyprus
-
 Czechia
-
 DR Congo
-
 Denmark
-
 Dominican Republic
-
 Ecuador
-
 Egypt
-
 El Salvador
-
 Estonia
-
 Eswatini
-
 Ethiopia
-
 Finland
-
 France
-
 Georgia
-
 Germany
-
 Ghana
-
 Greece
-
 Haiti
-
 Hong Kong
-
 Hungary
-
 India
-
 Indonesia
-
 Iran, Islamic republic
-
 Iraq
-
 Ireland
-
 Israel
-
 Italy
-
 Jamaica
-
 Japan
-
 Jordan
-
 Kazakhstan
-
 Kenya
-
 Korea
-
 Kuwait
-
 Kyrgyzstan
-
 Laos
-
 Latvia
-
 Lebanon
-
 Lesotho
-
 Libya
-
 Lithuania
-
 Luxembourg
-
 Madagascar
-
 Malaysia
-
 Malta
-
 Mauritius
-
 Mexico
-
 Moldova
-
 Mongolia
-
 Montenegro
-
 Morocco
-
 Mozambique
-
 Myanmar
-
 Namibia
-
 Nepal
-
 Netherlands
-
 New Zealand
-
 Nigeria
-
 North Macedonia
-
 Norway
-
 Oman
-
 Pakistan
-
 Palestine
-
 Panama
-
 Papua New Guinea
-
 Paraguay
-
 Peru
-
 Philippines
-
 Poland
-
 Portugal
-
 Puerto Rico
-
 Qatar
-
 Reunion
-
 Romania
-
 Rwanda
-
 Saudi Arabia
-
 Serbia
-
 Singapore
-
 Slovakia
-
 Slovenia
-
 Somalia
-
 South Africa
-
 Spain
-
 Sri Lanka
-
 Sweden
-
 Switzerland
-
 Syria
-
 Taiwan
-
 Tajikistan
-
 Tanzania
-
 Thailand
-
 Trinidad and Tobago
-
 Tunisia
-
 Turkey
-
 UAE
-
 Uganda
-
 Ukraine
-
 United Kingdom
-
United States
-
 Uruguay
-
 Uzbekistan
-
 Venezuela
-
 Vietnam
-
 Yemen
-
 Zambia
-
 Zimbabwe
- Forex
- Crypto












