

Riot Platforms stock outlook: Downward move as $13.92 support remains in focus

Riot Platforms (RIOT) stock is trading at $14.59, down 5.11% on the day. The price sits above its main short- and medium-term moving averages, but still below key long-term averages, reflecting ongoing volatility and mixed technical signals.
 17.12
17.12
Highlights
- Riot Platforms reported third-quarter 2026 revenue of $181.4 million driven by a 15-year Corsicana lease securing $28 billion in contracted revenue from a frontier AI lab.
- The company raised $1.5 billion through Bitcoin sales to fund its data center strategy without issuing new equity, preserving shareholder value.
- Riot Platforms stock trades at $14.59 within a volatile $10.98 to $16.63 range as mixed technical signals suggest sideways consolidation with a slight bias toward an upside rebound.
Contract wins and data center pivot drive stronger results amid selling
Riot Platforms reported third-quarter 2026 revenue of $181.4 million, driven by a 15-year, 910 MW Corsicana lease that secures $28 billion in contracted revenue with a frontier AI lab at a lower-than-average capital intensity, according to Yahoo Finance. The company financed its strategic shift to data centers through $1.5 billion in Bitcoin sales and did not issue new equity, helping preserve existing shareholder value, also per Yahoo Finance. Third-quarter results exceeded expectations with an EPS of $0.01 compared to an anticipated loss, reflecting stronger operational and revenue performance, according to Benzinga, though price action has remained under broader selling pressure.
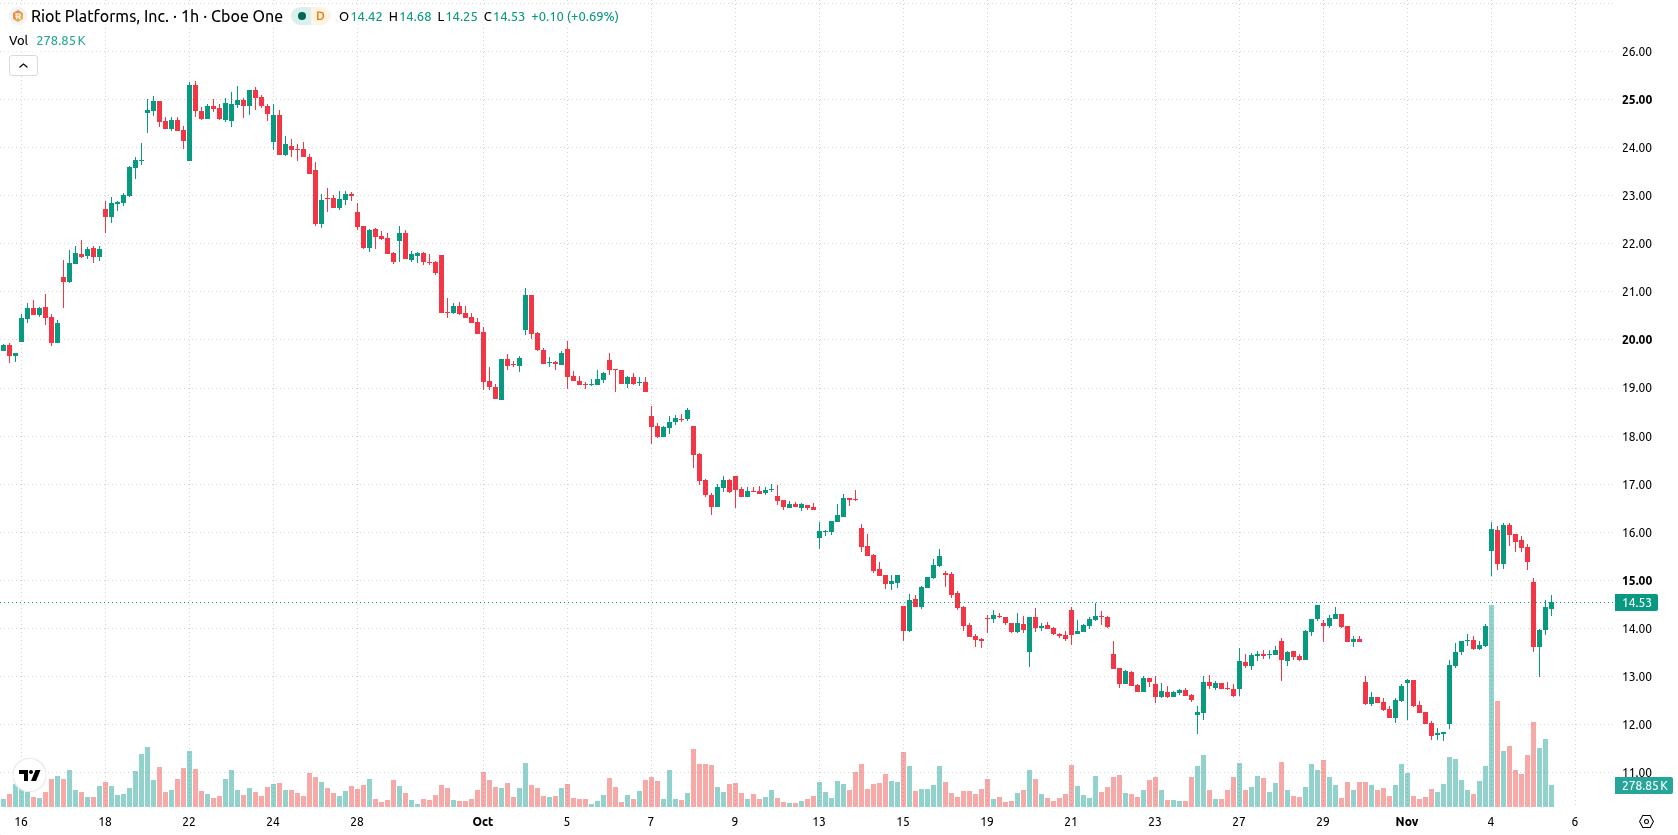
Bullish momentum offsets lingering long-term resistance in mixed signals
Technical analysis shows that RIOT is trading above its MA-20 and MA-50 on the hourly chart but remains below the MA-200, indicating immediate and medium-term technical support with lingering long-term resistance. The Ichimoku Kijun at $13.92 serves as the nearest downside support area. Bullish momentum is present on the MACD, while the ADX points to a selling bias. RSI and CCI are both in the neutral zone, but Stoch RSI is oversold, which could indicate a potential upward rebound. Intraday, sellers remain dominant as Bull/Bear Power is negative, and the Awesome Oscillator is neutral.
Sideways action projected as breakout risk remains in focus
Over the next two to three trading days, RIOT is expected to trade within a volatility band of $10.98 to $16.63. The probability of an upward move stands at 57%, with downside risk at 43%. The base case scenario is sideways consolidation between immediate support and resistance. A bullish break above the upper range could spark momentum toward further gains, while a loss of support below $13.92 would likely trigger additional selling pressure.
Previously it was reported that Riot Platforms shifted its core strategy to focus on large-scale AI data center investments, financed by significant Bitcoin reserve sales. The current technical setup highlights ongoing volatility and mixed momentum, making the $13.92 support level crucial to monitor for potential further downside or a rebound in the near term.









-
 Afghanistan
-
 Albania
-
 Algeria
-
 Angola
-
 Argentina
-
 Armenia
-
 Australia
-
 Austria
-
 Azerbaijan
-
 Bahamas
-
 Bahrain
-
 Bangladesh
-
 Belarus
-
 Belgium
-
 Bolivia
-
 Botswana
-
 Brazil
-
 Brunei
-
 Bulgaria
-
 Cambodia
-
 Cameroon
-
 Canada
-
 Chile
-
 China
-
 Colombia
-
 Congo
-
 Costa Rica
-
 Cote d'Ivoire
-
 Croatia
-
 Cuba
-
 Cyprus
-
 Czechia
-
 DR Congo
-
 Denmark
-
 Dominican Republic
-
 Ecuador
-
 Egypt
-
 El Salvador
-
 Estonia
-
 Eswatini
-
 Ethiopia
-
 Finland
-
 France
-
 Georgia
-
 Germany
-
 Ghana
-
 Greece
-
 Haiti
-
 Hong Kong
-
 Hungary
-
 India
-
 Indonesia
-
 Iran, Islamic republic
-
 Iraq
-
 Ireland
-
 Israel
-
 Italy
-
 Jamaica
-
 Japan
-
 Jordan
-
 Kazakhstan
-
 Kenya
-
 Korea
-
 Kuwait
-
 Kyrgyzstan
-
 Laos
-
 Latvia
-
 Lebanon
-
 Lesotho
-
 Libya
-
 Lithuania
-
 Luxembourg
-
 Madagascar
-
 Malaysia
-
 Malta
-
 Mauritius
-
 Mexico
-
 Moldova
-
 Mongolia
-
 Montenegro
-
 Morocco
-
 Mozambique
-
 Myanmar
-
 Namibia
-
 Nepal
-
 Netherlands
-
 New Zealand
-
 Nigeria
-
 North Macedonia
-
 Norway
-
 Oman
-
 Pakistan
-
 Palestine
-
 Panama
-
 Papua New Guinea
-
 Paraguay
-
 Peru
-
 Philippines
-
 Poland
-
 Portugal
-
 Puerto Rico
-
 Qatar
-
 Reunion
-
 Romania
-
 Rwanda
-
 Saudi Arabia
-
 Serbia
-
 Singapore
-
 Slovakia
-
 Slovenia
-
 Somalia
-
 South Africa
-
 Spain
-
 Sri Lanka
-
 Sweden
-
 Switzerland
-
 Syria
-
 Taiwan
-
 Tajikistan
-
 Tanzania
-
 Thailand
-
 Trinidad and Tobago
-
 Tunisia
-
 Turkey
-
 UAE
-
 Uganda
-
 Ukraine
-
 United Kingdom
-
United States
-
 Uruguay
-
 Uzbekistan
-
 Venezuela
-
 Vietnam
-
 Yemen
-
 Zambia
-
 Zimbabwe
- Forex
- Crypto












