

IDEX shares drop more than 4% after strong earnings met with broader selling pressure

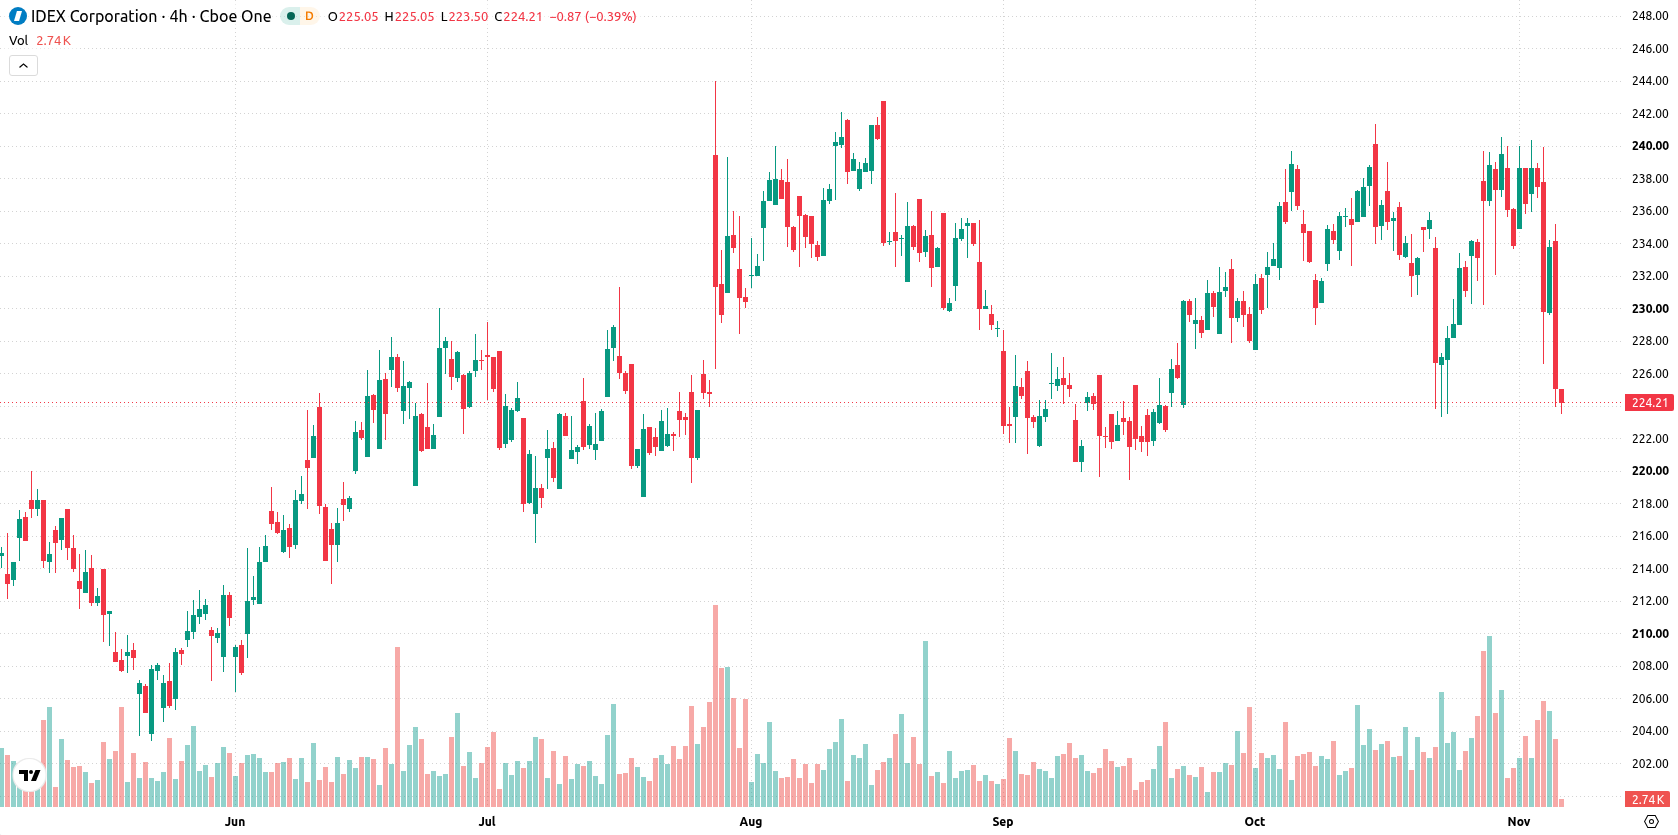
IDEX Corporation (IEX) fell 4.34% as sellers moved in after an early session gap, with the decline gaining momentum against the backdrop of the company's upbeat quarterly results. The move is supported by the stock's position below its 20- and 50-day moving averages, which confirms ongoing pressure on short- and medium-term trends.
 235.19
240.35
Highlights
- IDEX Corporation surpassed third quarter expectations and raised its full year adjusted earnings guidance.
- The company kept its quarterly dividend at $0.73 per share, offering a 1.3% annual yield.
- Shares of IDEX fell 4.34% to $223.6, with near-term trading expected in the $216.86 to $230.34 range amid mixed technical signals.
Upbeat results fail to offset persistent outflows and institutional selling
IDEX Corporation reported third quarter 2026 results that exceeded expectations and raised its full year adjusted earnings outlook. The company also maintained its quarterly dividend at $0.73 per share, yielding 1.3% annually. Boston Trust Walden Corp reduced its stake in IDEX during the third quarter, selling 18,600 shares, though price action has remained under broader selling pressure.
Mixed technical signals emerge as short-term pressure clashes with long-term support
IEX is trading below its 20-day and 50-day moving averages at $234.57 and $230.31, but remains above the 200-day moving average at $216.83. This setup signals ongoing pressure in the short- and medium-term but retains a positive longer-term trend. The nearest support stands at $216.86, with immediate resistance at $224.06, while Ichimoku Kijun levels and higher averages confirm an underlying bullish bias in the broader trend. Momentum indicators are mixed: MACD suggests strong buy momentum, but the Average Directional Index (ADX) is neutral and the Hull Moving Average shows selling pressure. The RSI, Stochastic RSI, and Commodity Channel Index (CCI) are all neutral, indicating no overbought or oversold conditions. Bull/Bear Power is positive, pointing to buyer strength in the near term, while the Awesome Oscillator remains neutral.
Earlier, analysts noted that IDEX was experiencing persistent short- and medium-term selling pressure despite a constructive longer-term technical setup. The current article reinforces this outlook amid ongoing volatility, highlighting $230.34 and $216.86 as key levels to monitor for any potential directional move outside the prevailing trading range.






Latest IDEX Corporation News




-
 Afghanistan
-
 Albania
-
 Algeria
-
 Angola
-
 Argentina
-
 Armenia
-
 Australia
-
 Austria
-
 Azerbaijan
-
 Bahamas
-
 Bahrain
-
 Bangladesh
-
 Belarus
-
 Belgium
-
 Bolivia
-
 Botswana
-
 Brazil
-
 Brunei
-
 Bulgaria
-
 Cambodia
-
 Cameroon
-
 Canada
-
 Chile
-
 China
-
 Colombia
-
 Congo
-
 Costa Rica
-
 Cote d'Ivoire
-
 Croatia
-
 Cuba
-
 Cyprus
-
 Czechia
-
 DR Congo
-
 Denmark
-
 Dominican Republic
-
 Ecuador
-
 Egypt
-
 El Salvador
-
 Estonia
-
 Eswatini
-
 Ethiopia
-
 Finland
-
 France
-
 Georgia
-
 Germany
-
 Ghana
-
 Greece
-
 Haiti
-
 Hong Kong
-
 Hungary
-
 India
-
 Indonesia
-
 Iran, Islamic republic
-
 Iraq
-
 Ireland
-
 Israel
-
 Italy
-
 Jamaica
-
 Japan
-
 Jordan
-
 Kazakhstan
-
 Kenya
-
 Korea
-
 Kuwait
-
 Kyrgyzstan
-
 Laos
-
 Latvia
-
 Lebanon
-
 Lesotho
-
 Libya
-
 Lithuania
-
 Luxembourg
-
 Madagascar
-
 Malaysia
-
 Malta
-
 Mauritius
-
 Mexico
-
 Moldova
-
 Mongolia
-
 Montenegro
-
 Morocco
-
 Mozambique
-
 Myanmar
-
 Namibia
-
 Nepal
-
 Netherlands
-
 New Zealand
-
 Nigeria
-
 North Macedonia
-
 Norway
-
 Oman
-
 Pakistan
-
 Palestine
-
 Panama
-
 Papua New Guinea
-
 Paraguay
-
 Peru
-
 Philippines
-
 Poland
-
 Portugal
-
 Puerto Rico
-
 Qatar
-
 Reunion
-
 Romania
-
 Rwanda
-
 Saudi Arabia
-
 Serbia
-
 Singapore
-
 Slovakia
-
 Slovenia
-
 Somalia
-
 South Africa
-
 Spain
-
 Sri Lanka
-
 Sweden
-
 Switzerland
-
 Syria
-
 Taiwan
-
 Tajikistan
-
 Tanzania
-
 Thailand
-
 Trinidad and Tobago
-
 Tunisia
-
 Turkey
-
 UAE
-
 Uganda
-
 Ukraine
-
 United Kingdom
-
United States
-
 Uruguay
-
 Uzbekistan
-
 Venezuela
-
 Vietnam
-
 Yemen
-
 Zambia
-
 Zimbabwe
- Forex
- Crypto












