


IDEX Corporation (IEX) fell 3.71% after the release date for its upcoming third quarter 2026 earnings was confirmed, extending downside momentum. The move is reinforced by bearish technicals, as IEX is trading below its 20-day and 50-day moving averages, which signals short- and medium-term selling pressure within an otherwise longer-term uptrend.
 240.00
240.32
Highlights
- IDEX Corporation will release third quarter 2026 earnings before the market opens on October 28.
- The company has paid a $2.92 per share dividend for 16 consecutive years, maintaining sustainable payouts versus peers.
- IDEX stock trades under short- and medium-term bearish pressure but is in a long-term uptrend, with a near-term range of $222.46 to $236.85 and overbought momentum signals despite recent price declines.
Steady dividends and diversified operations support sentiment amid price pressure
IDEX Corporation is scheduled to release its third quarter 2026 earnings before the market opens on October 28. The company remains recognized for its diversified industrial manufacturing operations and has maintained a steady dividend of $2.92 per share, with 16 consecutive years of dividend growth. Recent reports note the sustainability of its dividend payout compared to industry peers, though price action has remained under broader selling pressure.
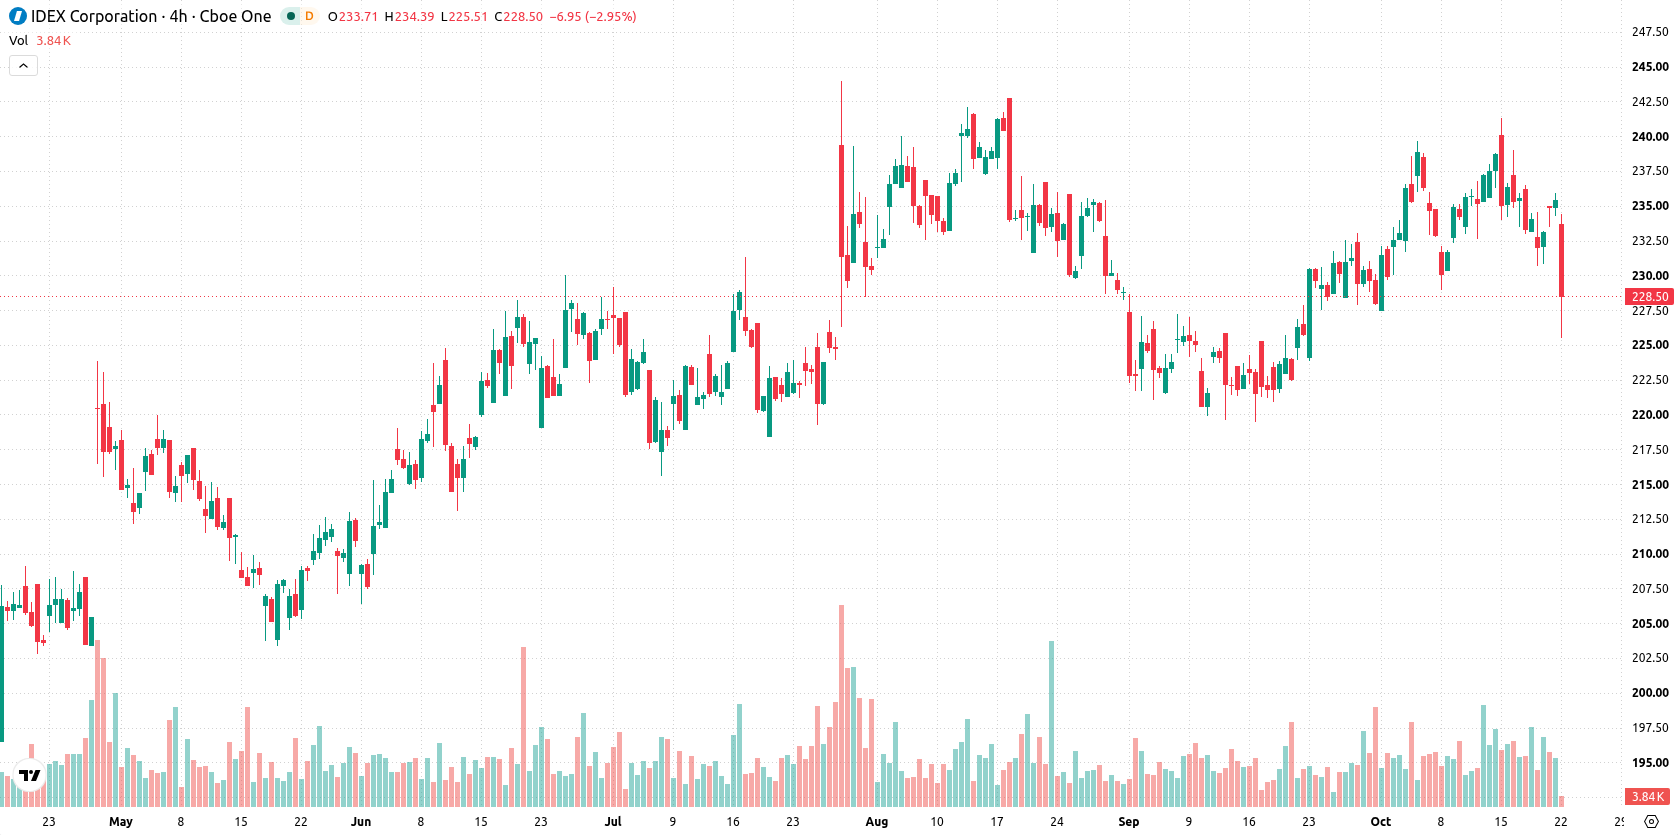
Short-term bearish patterns clash with bullish momentum signals
IDEX is currently trading below its 20-day moving average at $233.39 and the 50-day moving average at $230.72, but remains above its 200-day moving average at $214.55. This setup indicates short- and medium-term bearish pressure, contrasted by a broader long-term uptrend. Resistance stands at the Ichimoku Kijun level of $230.03, while support is at $222.46. Momentum signals are mixed: MACD points to strong buy momentum, whereas ADX and CCI reflect a neutral outlook. The RSI and Stochastic RSI both tilt bullish, suggesting possible upward moves. Bull/Bear Power (BBP) at 1.68 shows buyers lead intraday action, but also signals overbought conditions. The session featured declining prices with a 3.71% single-day drop following a downside gap, trade near the day's low, and 1.07% intraday volatility. Price remains pressured after the open, which is at odds with mostly bullish momentum cues.
Earlier, analysts noted expectations for price consolidation in IDEX within a defined range, with higher odds of an upward move if resistance levels were surpassed. The current article strengthens this view, as mixed momentum signals and intraday overbought readings highlight $230.03 as a key level to watch for confirmation of any near-term trend reversal.






Latest IDEX Corporation News



-
 Afghanistan
-
 Albania
-
 Algeria
-
 Angola
-
 Argentina
-
 Armenia
-
 Australia
-
 Austria
-
 Azerbaijan
-
 Bahamas
-
 Bahrain
-
 Bangladesh
-
 Belarus
-
 Belgium
-
 Bolivia
-
 Botswana
-
 Brazil
-
 Brunei
-
 Bulgaria
-
 Cambodia
-
 Cameroon
-
 Canada
-
 Chile
-
 China
-
 Colombia
-
 Congo
-
 Costa Rica
-
 Cote d'Ivoire
-
 Croatia
-
 Cuba
-
 Cyprus
-
 Czechia
-
 DR Congo
-
 Denmark
-
 Dominican Republic
-
 Ecuador
-
 Egypt
-
 El Salvador
-
 Estonia
-
 Eswatini
-
 Ethiopia
-
 Finland
-
 France
-
 Georgia
-
 Germany
-
 Ghana
-
 Greece
-
 Haiti
-
 Hong Kong
-
 Hungary
-
 India
-
 Indonesia
-
 Iran, Islamic republic
-
 Iraq
-
 Ireland
-
 Israel
-
 Italy
-
 Jamaica
-
 Japan
-
 Jordan
-
 Kazakhstan
-
 Kenya
-
 Korea
-
 Kuwait
-
 Kyrgyzstan
-
 Laos
-
 Latvia
-
 Lebanon
-
 Lesotho
-
 Libya
-
 Lithuania
-
 Luxembourg
-
 Madagascar
-
 Malaysia
-
 Malta
-
 Mauritius
-
 Mexico
-
 Moldova
-
 Mongolia
-
 Montenegro
-
 Morocco
-
 Mozambique
-
 Myanmar
-
 Namibia
-
 Nepal
-
 Netherlands
-
 New Zealand
-
 Nigeria
-
 North Macedonia
-
 Norway
-
 Oman
-
 Pakistan
-
 Palestine
-
 Panama
-
 Papua New Guinea
-
 Paraguay
-
 Peru
-
 Philippines
-
 Poland
-
 Portugal
-
 Puerto Rico
-
 Qatar
-
 Reunion
-
 Romania
-
 Rwanda
-
 Saudi Arabia
-
 Serbia
-
 Singapore
-
 Slovakia
-
 Slovenia
-
 Somalia
-
 South Africa
-
 Spain
-
 Sri Lanka
-
 Sweden
-
 Switzerland
-
 Syria
-
 Taiwan
-
 Tajikistan
-
 Tanzania
-
 Thailand
-
 Trinidad and Tobago
-
 Tunisia
-
 Turkey
-
 UAE
-
 Uganda
-
 Ukraine
-
 United Kingdom
-
United States
-
 Uruguay
-
 Uzbekistan
-
 Venezuela
-
 Vietnam
-
 Yemen
-
 Zambia
-
 Zimbabwe
- Forex
- Crypto












