

IEX slides over 3% as price trades below key moving averages and sellers remain dominant

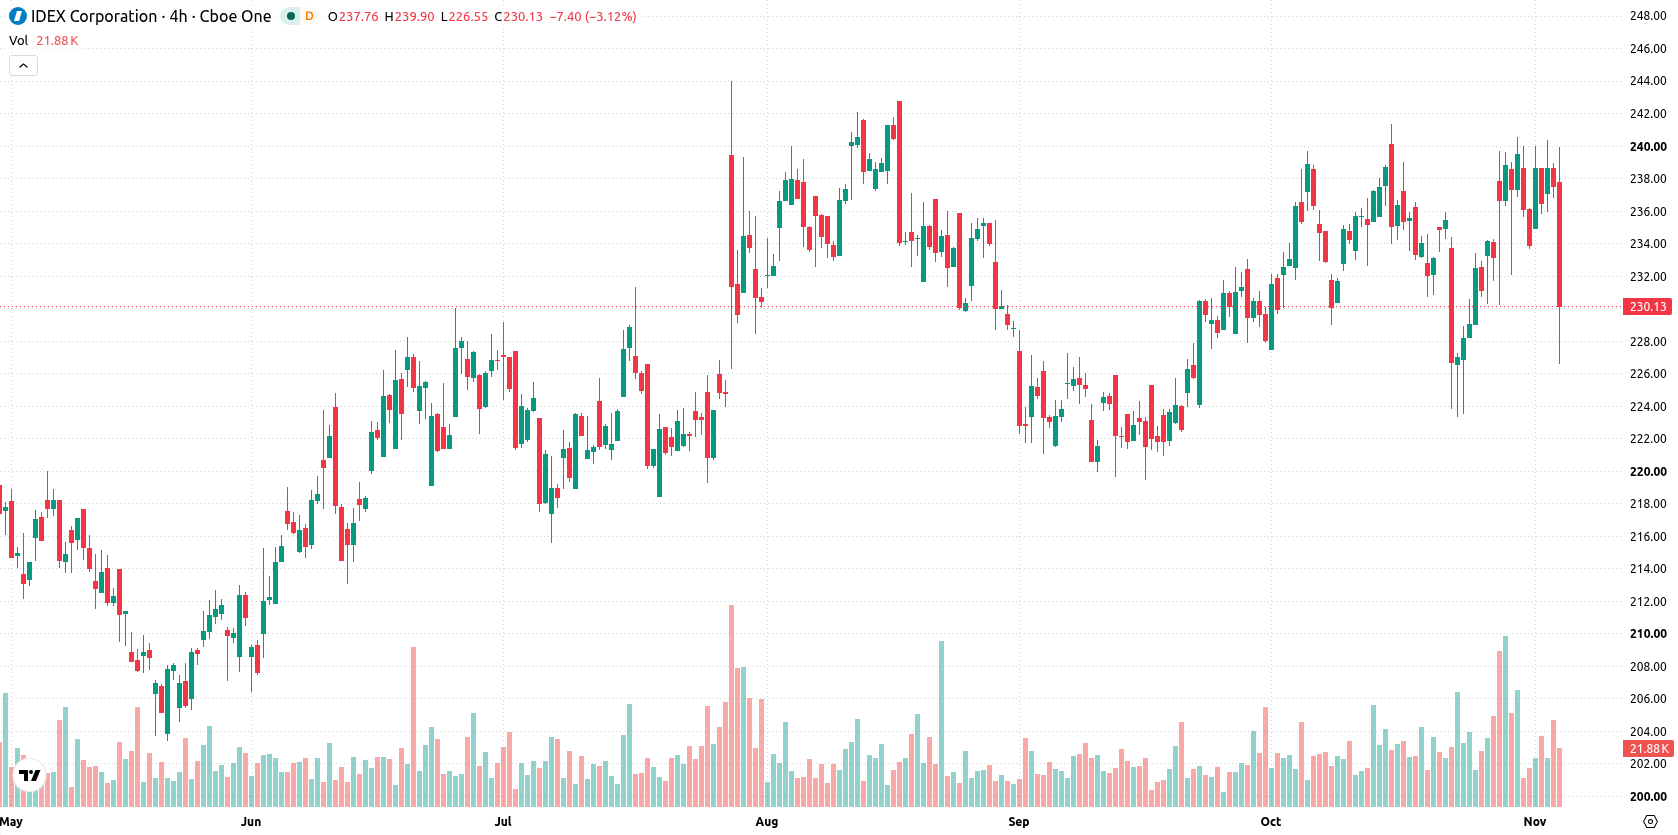
IDEX Corporation (IEX) fell 3.1% as persistent selling pressure weighed on the stock, even as earnings and revenue from industry peer IDEXX Laboratories provided a positive backdrop for the diagnostics sector. The move is reinforced by IDEX trading below its near-term moving averages, indicating ongoing short- and medium-term weakness despite a bullish long-term trend structure.
 234.42
239.81
Highlights
- IDEXX Laboratories reported third-quarter revenue of $1.21 billion, marking a 10% increase year-over-year with EPS up 18% to $4.01.
- The company raised its full-year guidance for 2026 revenue to a projected range of $4.741 billion to $4.767 billion.
- Shares of IDEXX Laboratories are trading below key moving averages, with short- and medium-term selling pressure and an expected price range of $218.72 to $234.02 over five days.
Investor repositioning and strong IDEXX results contrast with IDEX sell-off
IDEXX Laboratories, Inc. reported third-quarter revenue of $1.21 billion, up 10% year-over-year, and an 18% increase in diluted earnings per share to $4.01. The company also raised its full-year guidance, projecting revenue between $4.741 billion and $4.767 billion for 2026. Institutional investors adjusted their stakes during the quarter. These results were accompanied by broader selling pressure on IDEX.
Short-term weakness persists as oscillators diverge and volatility spikes
IDEX is trading below its 20-day and 50-day moving averages, with the price at $230 compared to the MA-20 at $234.53 and MA-50 at $230.25, but remains above the 200-day moving average at $216.63. This configuration signals short- and medium-term pressure from sellers, while the stock retains a bullish long-term trend bias based on the MA-50 versus MA-200 alignment. The near-term ceiling is $230.25 and the near-term floor is $226.46. Momentum signals present a mixed picture. The MACD suggests a buy signal and the ADX points to a neutral trend. The Relative Strength Index (RSI) is neutral, as is the Stochastic RSI. The Commodity Channel Index (CCI) is in the overbought zone, indicating possible overheating risk. Bull/Bear Power (BBP) is positive, confirming buyers are dominant intraday. The Awesome Oscillator provides additional support for a bullish bias. The stock is down $7.36 or 3.1% so far today, having opened with an upside gap of $1.64 (0.69%). The price is currently near the session low with intraday volatility at 5.54%. This suggests persistent pressure after the open, even as momentum and BBP indicate strong buying activity. The divergence in oscillator zones and momentum warns of potential reversal or corrective action.
Earlier, analysts noted that IDEX was experiencing short- and medium-term selling pressure despite maintaining a constructive long-term trend. The latest price action and indicator divergence reinforce the case for near-term consolidation, with traders advised to monitor $226.46 as a pivotal support level in the days ahead.






Latest IDEX Corporation News




-
 Afghanistan
-
 Albania
-
 Algeria
-
 Angola
-
 Argentina
-
 Armenia
-
 Australia
-
 Austria
-
 Azerbaijan
-
 Bahamas
-
 Bahrain
-
 Bangladesh
-
 Belarus
-
 Belgium
-
 Bolivia
-
 Botswana
-
 Brazil
-
 Brunei
-
 Bulgaria
-
 Cambodia
-
 Cameroon
-
 Canada
-
 Chile
-
 China
-
 Colombia
-
 Congo
-
 Costa Rica
-
 Cote d'Ivoire
-
 Croatia
-
 Cuba
-
 Cyprus
-
 Czechia
-
 DR Congo
-
 Denmark
-
 Dominican Republic
-
 Ecuador
-
 Egypt
-
 El Salvador
-
 Estonia
-
 Eswatini
-
 Ethiopia
-
 Finland
-
 France
-
 Georgia
-
 Germany
-
 Ghana
-
 Greece
-
 Haiti
-
 Hong Kong
-
 Hungary
-
 India
-
 Indonesia
-
 Iran, Islamic republic
-
 Iraq
-
 Ireland
-
 Israel
-
 Italy
-
 Jamaica
-
 Japan
-
 Jordan
-
 Kazakhstan
-
 Kenya
-
 Korea
-
 Kuwait
-
 Kyrgyzstan
-
 Laos
-
 Latvia
-
 Lebanon
-
 Lesotho
-
 Libya
-
 Lithuania
-
 Luxembourg
-
 Madagascar
-
 Malaysia
-
 Malta
-
 Mauritius
-
 Mexico
-
 Moldova
-
 Mongolia
-
 Montenegro
-
 Morocco
-
 Mozambique
-
 Myanmar
-
 Namibia
-
 Nepal
-
 Netherlands
-
 New Zealand
-
 Nigeria
-
 North Macedonia
-
 Norway
-
 Oman
-
 Pakistan
-
 Palestine
-
 Panama
-
 Papua New Guinea
-
 Paraguay
-
 Peru
-
 Philippines
-
 Poland
-
 Portugal
-
 Puerto Rico
-
 Qatar
-
 Reunion
-
 Romania
-
 Rwanda
-
 Saudi Arabia
-
 Serbia
-
 Singapore
-
 Slovakia
-
 Slovenia
-
 Somalia
-
 South Africa
-
 Spain
-
 Sri Lanka
-
 Sweden
-
 Switzerland
-
 Syria
-
 Taiwan
-
 Tajikistan
-
 Tanzania
-
 Thailand
-
 Trinidad and Tobago
-
 Tunisia
-
 Turkey
-
 UAE
-
 Uganda
-
 Ukraine
-
 United Kingdom
-
United States
-
 Uruguay
-
 Uzbekistan
-
 Venezuela
-
 Vietnam
-
 Yemen
-
 Zambia
-
 Zimbabwe
- Forex
- Crypto












