

Bit Digital stock extends lower while oversold indicators signal possible exhaustion

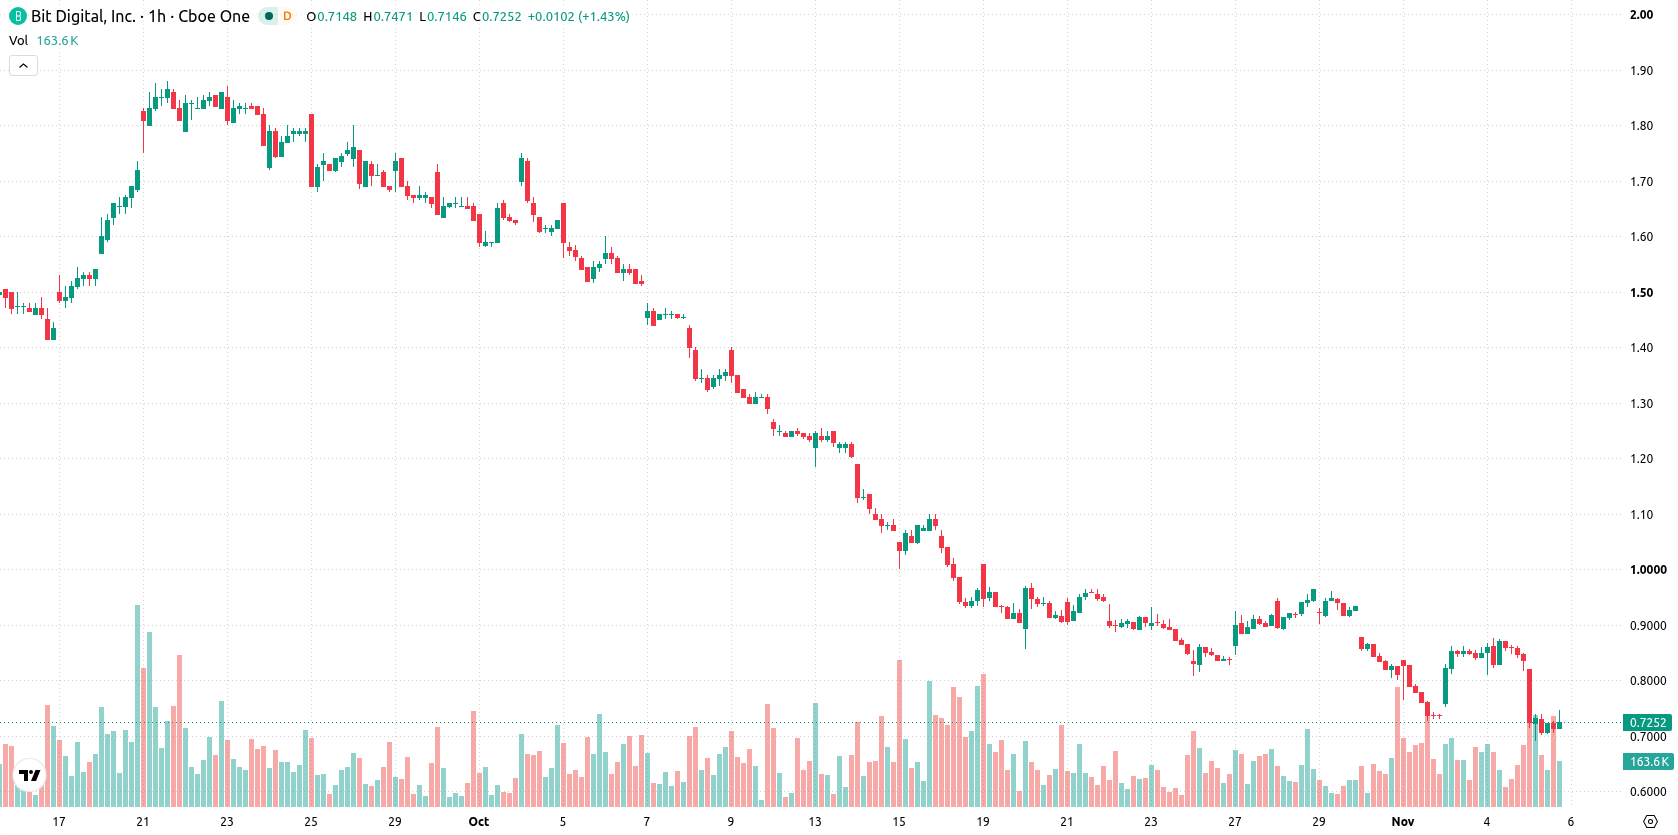
Bit Digital Inc. (BTBT) stock is trading at $0.72, down 13.25% for the session and marking one of the biggest declines on the day. The price is currently positioned below its key moving averages, reflecting ongoing weakness in the stock's trading profile.
 0.6659
0.8386
Highlights
- BTBT/USD trades below key moving averages on hourly and daily charts, confirming persistent downward momentum across timeframes.
- Momentum indicators including MACD, ADX, and AO register sell signals, while several oscillators signal oversold conditions without confirming a rebound.
- The pair is projected to consolidate between $0.58 to $0.79 over the next 2 to 3 sessions, with a high probability of further declines unless a breakout above $0.78 occurs.
Bearish momentum confirmed as technical barriers cap rebound attempts
On the technical front, BTBT is trading below the MA-20 ($0.81) and MA-50 ($0.86) on the H1 timeframe, and remains under the MA-200 ($1.6) on the daily chart. The Ichimoku Kijun at $0.78 serves as immediate resistance. Indicators present a weak momentum picture: both MACD and ADX flag sell signals, while Bull/Bear Power and Awesome Oscillator are negative, confirming continued selling pressure intraday. RSI remains in neutral territory, with Stochastic RSI and CCI both oversold, suggesting selling exhaustion is possible but not confirmed.
Downside risk elevated as rangebound trading likely prevails
Over the next 2–3 trading days, BTBT is expected to fluctuate between $0.58 and $0.79, which frames the typical volatility band relative to current levels. The probability of a rebound remains low, while the risk of further downside is high. Any bullish scenario would require a decisive move above resistance at $0.78, whereas a clear drop below $0.58 could accelerate declines, with sideways consolidation as the base case.
Earlier, analysts noted that Bit Digital was under sustained bearish pressure with a continued risk of further declines as technical conditions deteriorated. Current intraday signals reinforce this negative outlook, and traders should monitor for a decisive move above $0.78 or a breakdown below $0.58 to gauge the next directional shift.









-
 Afghanistan
-
 Albania
-
 Algeria
-
 Angola
-
 Argentina
-
 Armenia
-
 Australia
-
 Austria
-
 Azerbaijan
-
 Bahamas
-
 Bahrain
-
 Bangladesh
-
 Belarus
-
 Belgium
-
 Bolivia
-
 Botswana
-
 Brazil
-
 Brunei
-
 Bulgaria
-
 Cambodia
-
 Cameroon
-
 Canada
-
 Chile
-
 China
-
 Colombia
-
 Congo
-
 Costa Rica
-
 Cote d'Ivoire
-
 Croatia
-
 Cuba
-
 Cyprus
-
 Czechia
-
 DR Congo
-
 Denmark
-
 Dominican Republic
-
 Ecuador
-
 Egypt
-
 El Salvador
-
 Estonia
-
 Eswatini
-
 Ethiopia
-
 Finland
-
 France
-
 Georgia
-
 Germany
-
 Ghana
-
 Greece
-
 Haiti
-
 Hong Kong
-
 Hungary
-
 India
-
 Indonesia
-
 Iran, Islamic republic
-
 Iraq
-
 Ireland
-
 Israel
-
 Italy
-
 Jamaica
-
 Japan
-
 Jordan
-
 Kazakhstan
-
 Kenya
-
 Korea
-
 Kuwait
-
 Kyrgyzstan
-
 Laos
-
 Latvia
-
 Lebanon
-
 Lesotho
-
 Libya
-
 Lithuania
-
 Luxembourg
-
 Madagascar
-
 Malaysia
-
 Malta
-
 Mauritius
-
 Mexico
-
 Moldova
-
 Mongolia
-
 Montenegro
-
 Morocco
-
 Mozambique
-
 Myanmar
-
 Namibia
-
 Nepal
-
 Netherlands
-
 New Zealand
-
 Nigeria
-
 North Macedonia
-
 Norway
-
 Oman
-
 Pakistan
-
 Palestine
-
 Panama
-
 Papua New Guinea
-
 Paraguay
-
 Peru
-
 Philippines
-
 Poland
-
 Portugal
-
 Puerto Rico
-
 Qatar
-
 Reunion
-
 Romania
-
 Rwanda
-
 Saudi Arabia
-
 Serbia
-
 Singapore
-
 Slovakia
-
 Slovenia
-
 Somalia
-
 South Africa
-
 Spain
-
 Sri Lanka
-
 Sweden
-
 Switzerland
-
 Syria
-
 Taiwan
-
 Tajikistan
-
 Tanzania
-
 Thailand
-
 Trinidad and Tobago
-
 Tunisia
-
 Turkey
-
 UAE
-
 Uganda
-
 Ukraine
-
 United Kingdom
-
United States
-
 Uruguay
-
 Uzbekistan
-
 Venezuela
-
 Vietnam
-
 Yemen
-
 Zambia
-
 Zimbabwe
- Forex
- Crypto












