

Tesco stock slides as sellers control short-term momentum and downward price move persists

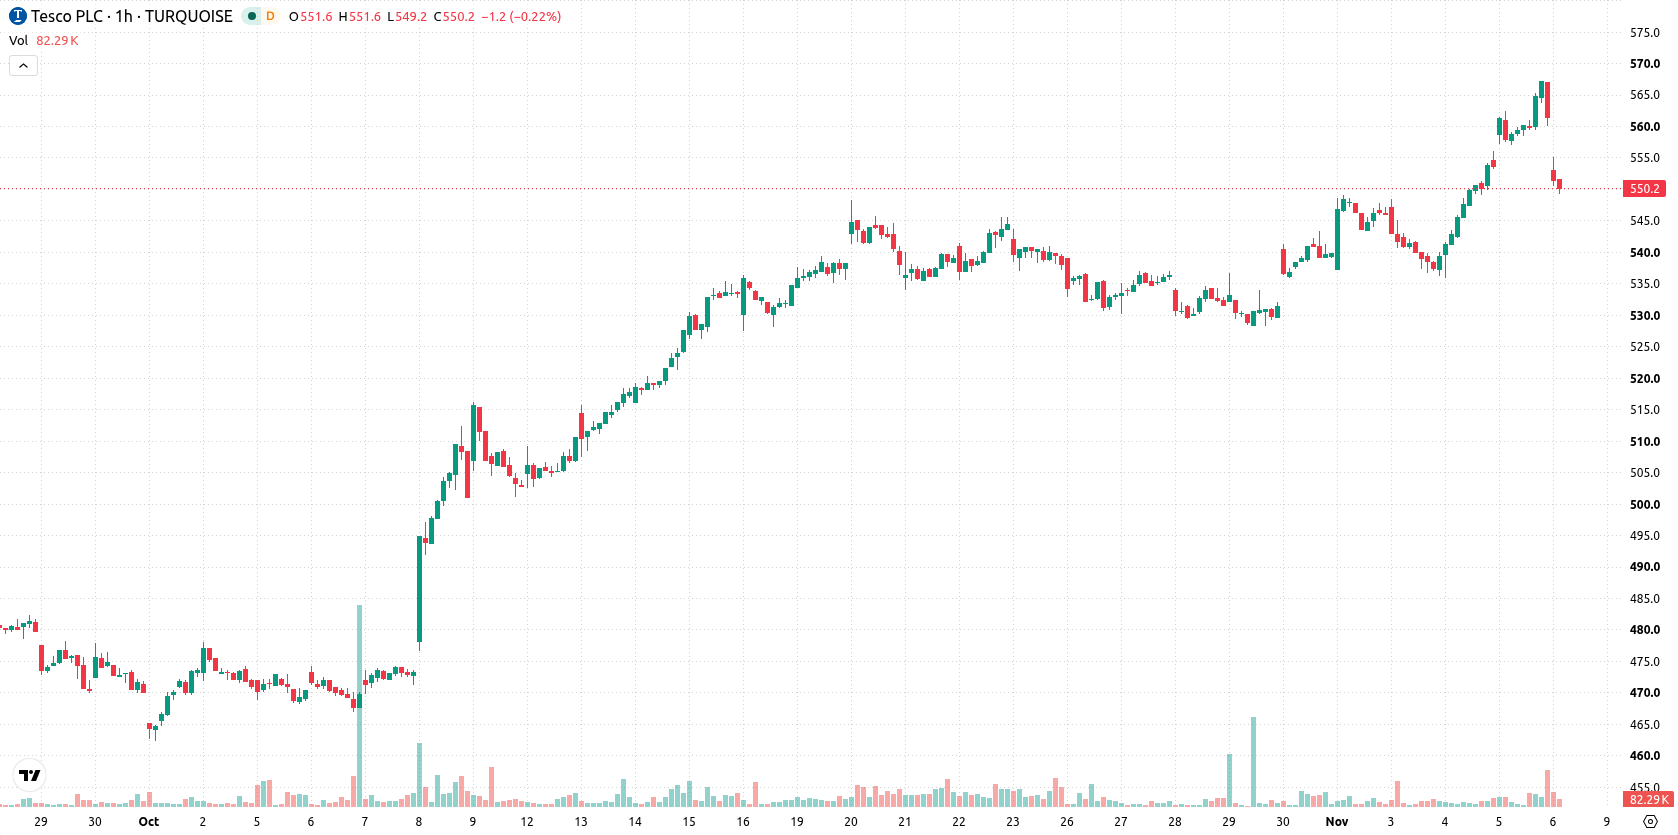
Tesco (TSCO) stock is trading at GBX549.2, marking a decrease of 2.07% on the day. The price remains under short-term seller pressure and currently sits below its key short-term moving average but continues to hold above medium- and long-term averages.
 555.20
567.20
Highlights
- Shares of TSCO closed at GBX549.2, down 2.07%, slipping near the day low after a price gap.
- Short- and medium-term indicators show increased seller pressure, but the long-term trend remains upward.
- The likely trading range for the next several days is GBX534.98 to GBX563.42, with a 55% probability of an upward move.
Momentum divergence with bearish bias under immediate resistance
On the technical front, TSCO is trading below the MA-20 but remains above the MA-50 on the hourly chart, while price holds well above the long-term MA-200. The Ichimoku Kijun at GBX551.4 now marks immediate resistance. MACD indicates a strong buy signal, whereas ADX suggests selling pressure, illustrating momentum divergence. RSI and CCI readings are neutral by their zone definitions, but Stoch RSI is currently oversold, flagging potential for a short-term rebound. Sellers dominate intraday momentum, as indicated by a negative Bull/Bear Power value. Awesome Oscillator remains neutral, with the session ending near the daily low and with low volatility.
Consolidation favored as risk skews slightly to upside
In the near term, the expected trading range for TSCO spans GBX534.98 to GBX563.42, reflecting a typical volatility band relative to current levels. The probability of an upward move marginally outweighs the downside at 55% versus 45%. The baseline scenario sees price consolidating within these boundaries. Should the price break above immediate resistance, further upside could be triggered, while a move below support would likely reinforce bearish short-term momentum.
Earlier, analysts noted that Tesco's improved shareholder returns and sector dynamics had reinforced the company's underlying bullish momentum despite bouts of selling pressure. The current technical setup highlights a narrowing battle between buyers and sellers, making the resolution of price action around GBX551.4 a key signal for traders seeking direction in the days ahead.










-
 Afghanistan
-
 Albania
-
 Algeria
-
 Angola
-
 Argentina
-
 Armenia
-
 Australia
-
 Austria
-
 Azerbaijan
-
 Bahamas
-
 Bahrain
-
 Bangladesh
-
 Belarus
-
 Belgium
-
 Bolivia
-
 Botswana
-
 Brazil
-
 Brunei
-
 Bulgaria
-
 Cambodia
-
 Cameroon
-
 Canada
-
 Chile
-
 China
-
 Colombia
-
 Congo
-
 Costa Rica
-
 Cote d'Ivoire
-
 Croatia
-
 Cuba
-
 Cyprus
-
 Czechia
-
 DR Congo
-
 Denmark
-
 Dominican Republic
-
 Ecuador
-
 Egypt
-
 El Salvador
-
 Estonia
-
 Eswatini
-
 Ethiopia
-
 Finland
-
 France
-
 Georgia
-
 Germany
-
 Ghana
-
 Greece
-
 Haiti
-
 Hong Kong
-
 Hungary
-
 India
-
 Indonesia
-
 Iran, Islamic republic
-
 Iraq
-
 Ireland
-
 Israel
-
 Italy
-
 Jamaica
-
 Japan
-
 Jordan
-
 Kazakhstan
-
 Kenya
-
 Korea
-
 Kuwait
-
 Kyrgyzstan
-
 Laos
-
 Latvia
-
 Lebanon
-
 Lesotho
-
 Libya
-
 Lithuania
-
 Luxembourg
-
 Madagascar
-
 Malaysia
-
 Malta
-
 Mauritius
-
 Mexico
-
 Moldova
-
 Mongolia
-
 Montenegro
-
 Morocco
-
 Mozambique
-
 Myanmar
-
 Namibia
-
 Nepal
-
 Netherlands
-
 New Zealand
-
 Nigeria
-
 North Macedonia
-
 Norway
-
 Oman
-
 Pakistan
-
 Palestine
-
 Panama
-
 Papua New Guinea
-
 Paraguay
-
 Peru
-
 Philippines
-
 Poland
-
 Portugal
-
 Puerto Rico
-
 Qatar
-
 Reunion
-
 Romania
-
 Rwanda
-
 Saudi Arabia
-
 Serbia
-
 Singapore
-
 Slovakia
-
 Slovenia
-
 Somalia
-
 South Africa
-
 Spain
-
 Sri Lanka
-
 Sweden
-
 Switzerland
-
 Syria
-
 Taiwan
-
 Tajikistan
-
 Tanzania
-
 Thailand
-
 Trinidad and Tobago
-
 Tunisia
-
 Turkey
-
 UAE
-
 Uganda
-
 Ukraine
-
 United Kingdom
-
United States
-
 Uruguay
-
 Uzbekistan
-
 Venezuela
-
 Vietnam
-
 Yemen
-
 Zambia
-
 Zimbabwe
- Forex
- Crypto












