

Bank of Nova Scotia shares technical analysis: Consolidating below C$131.96 resistance with weak momentum

Bank of Nova Scotia (BNS) stock is trading at C$128.93 after a modest intraday gain. The price sits below its short- and medium-term moving averages but remains above key longer-term averages, suggesting current downside momentum within an overall resilient long-term structure.
 126.94
132.95
Highlights
- Bank of Nova Scotia returned C$6.3 billion to shareholders in the first nine months of fiscal 2026 through dividends and buybacks.
- Operational restructuring in Canadian and Asian units targets cost efficiency and margin improvement, supported by better-than-expected recent earnings and a 4.7% dividend yield.
- Shares of Bank of Nova Scotia face short- and medium-term downward pressure with strong selling momentum but are oversold, trading in a projected C$125.72 to C$131.98 range.
Shareholder returns rise as restructuring and earnings beat drive optimism
Bank of Nova Scotia returned C$6.3 billion to shareholders through dividends and share buybacks in the first nine months of fiscal 2026, signaling a commitment to capital discipline and directly increasing income for investors. Operational restructuring across its Canadian and Asian segments, as cited by Kalkine, aims to streamline business operations and improve cost efficiency, offering a clearer path to margin improvement. The bank’s recent quarterly earnings outpaced analyst expectations, alongside a strong 4.7% dividend yield and a board-authorized buyback plan for up to 40,000,000 shares, supporting ongoing shareholder value creation.
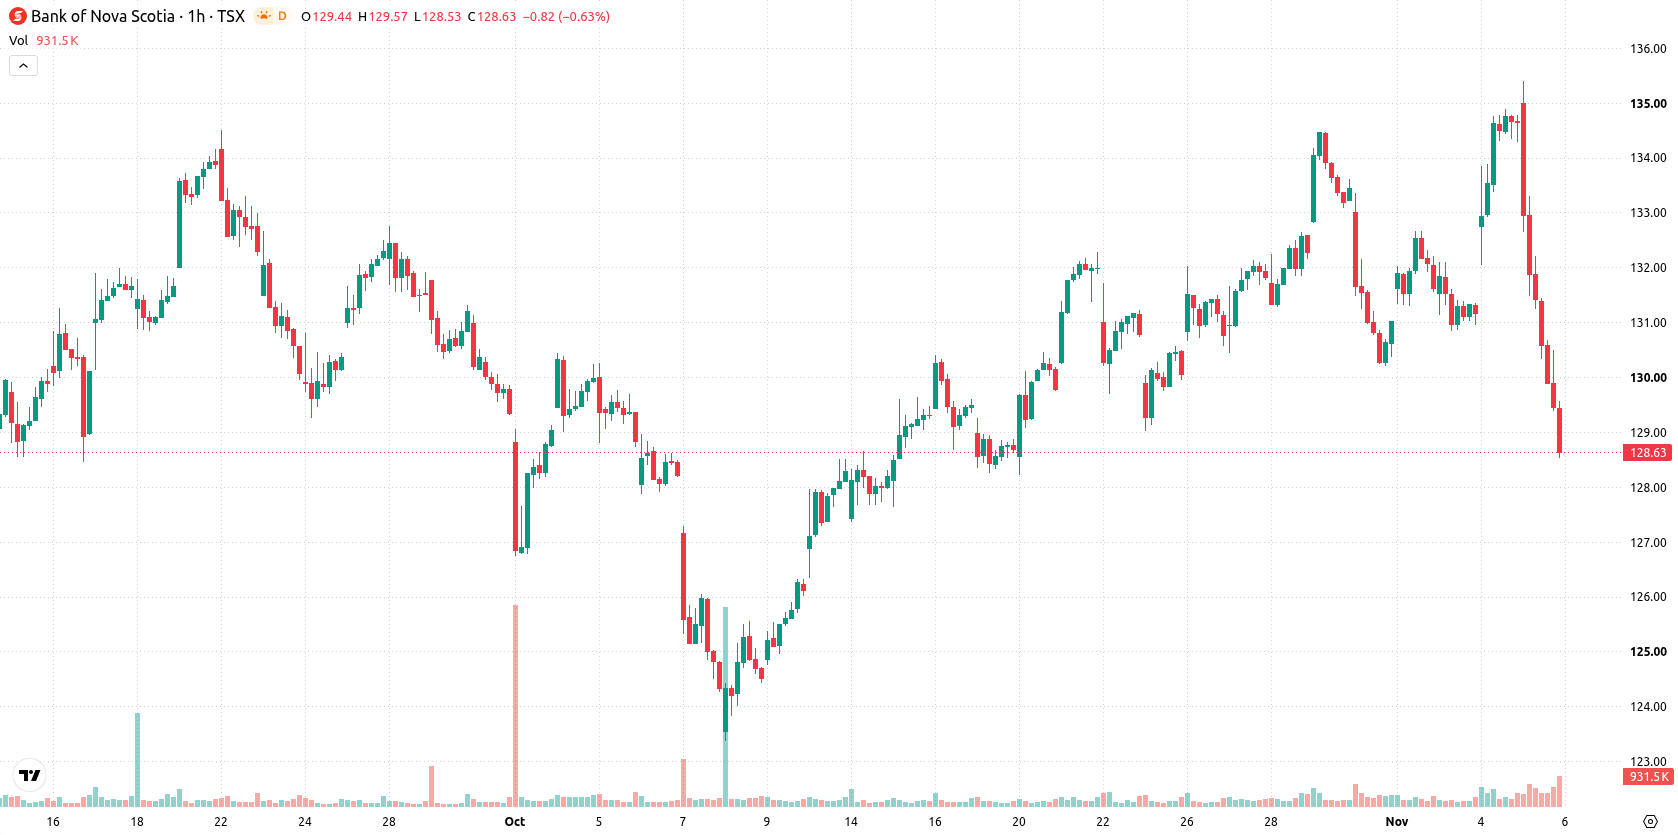
Seller dominance confirmed as momentum turns deeply oversold
On the technical front, BNS is trading below the MA-20 (C$132.1) and MA-50 (C$132.13) levels on the hourly chart, with the MA-200 (C$114.99) providing long-term support. The Ichimoku Kijun is set at C$131.96 and currently acts as immediate resistance. MACD and ADX confirm selling momentum, while RSI at 28.84, Stochastic RSI at 0, and CCI at –144.46 all register in deeply oversold territory, indicating that the recent price weakness could see a relief bounce. Bull/Bear Power is negative at –1.78, confirming seller dominance in the intraday session, and the Awesome Oscillator remains on the sell side, reinforcing the prevailing weakness.
Further price weakness likely as consolidation risk persists
Looking ahead, the typical volatility range for BNS over the coming days is projected between C$125.72 and C$131.98. With a 77% probability of further downside, the baseline scenario points to price consolidating sideways within this corridor. If the stock breaks above the C$131.96 resistance, a recovery attempt could develop. However, a sustained move below C$125.72 support would likely accelerate further declines in the short term.
Earlier, analysts noted that Bank of Nova Scotia maintained a resilient long-term technical structure despite episodes of short-term selling pressure. The current analysis signals a shift toward downside momentum, making the C$125.72 support level critical to monitor for signs of a potential acceleration in near-term declines.






Latest Bank of Nova Scotia News




-
 Afghanistan
-
 Albania
-
 Algeria
-
 Angola
-
 Argentina
-
 Armenia
-
 Australia
-
 Austria
-
 Azerbaijan
-
 Bahamas
-
 Bahrain
-
 Bangladesh
-
 Belarus
-
 Belgium
-
 Bolivia
-
 Botswana
-
 Brazil
-
 Brunei
-
 Bulgaria
-
 Cambodia
-
 Cameroon
-
 Canada
-
 Chile
-
 China
-
 Colombia
-
 Congo
-
 Costa Rica
-
 Cote d'Ivoire
-
 Croatia
-
 Cuba
-
 Cyprus
-
 Czechia
-
 DR Congo
-
 Denmark
-
 Dominican Republic
-
 Ecuador
-
 Egypt
-
 El Salvador
-
 Estonia
-
 Eswatini
-
 Ethiopia
-
 Finland
-
 France
-
 Georgia
-
 Germany
-
 Ghana
-
 Greece
-
 Haiti
-
 Hong Kong
-
 Hungary
-
 India
-
 Indonesia
-
 Iran, Islamic republic
-
 Iraq
-
 Ireland
-
 Israel
-
 Italy
-
 Jamaica
-
 Japan
-
 Jordan
-
 Kazakhstan
-
 Kenya
-
 Korea
-
 Kuwait
-
 Kyrgyzstan
-
 Laos
-
 Latvia
-
 Lebanon
-
 Lesotho
-
 Libya
-
 Lithuania
-
 Luxembourg
-
 Madagascar
-
 Malaysia
-
 Malta
-
 Mauritius
-
 Mexico
-
 Moldova
-
 Mongolia
-
 Montenegro
-
 Morocco
-
 Mozambique
-
 Myanmar
-
 Namibia
-
 Nepal
-
 Netherlands
-
 New Zealand
-
 Nigeria
-
 North Macedonia
-
 Norway
-
 Oman
-
 Pakistan
-
 Palestine
-
 Panama
-
 Papua New Guinea
-
 Paraguay
-
 Peru
-
 Philippines
-
 Poland
-
 Portugal
-
 Puerto Rico
-
 Qatar
-
 Reunion
-
 Romania
-
 Rwanda
-
 Saudi Arabia
-
 Serbia
-
 Singapore
-
 Slovakia
-
 Slovenia
-
 Somalia
-
 South Africa
-
 Spain
-
 Sri Lanka
-
 Sweden
-
 Switzerland
-
 Syria
-
 Taiwan
-
 Tajikistan
-
 Tanzania
-
 Thailand
-
 Trinidad and Tobago
-
 Tunisia
-
 Turkey
-
 UAE
-
 Uganda
-
 Ukraine
-
 United Kingdom
-
United States
-
 Uruguay
-
 Uzbekistan
-
 Venezuela
-
 Vietnam
-
 Yemen
-
 Zambia
-
 Zimbabwe
- Forex
- Crypto












