

Barrick Gold reports mixed Q1 results: Can ABX regain momentum?

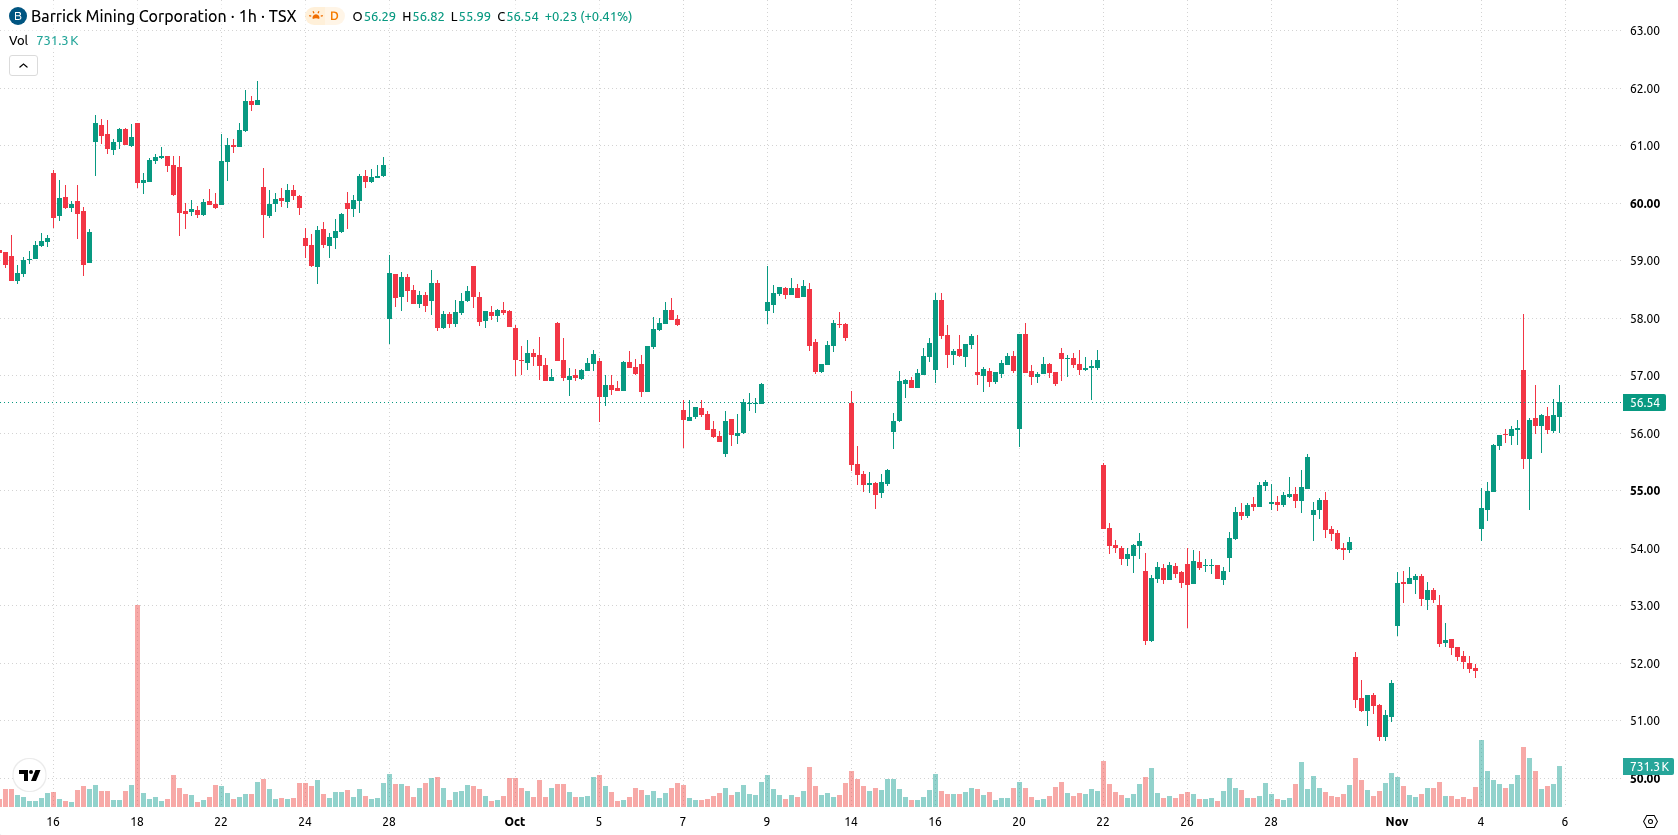
Barrick Gold (ABX) stock is trading at C$56.14, marking a modest move lower on the session. The price sits above its key short- and medium-term moving averages but remains below longer-term averages, reflecting mixed momentum in the current trading environment.
 54.37
60.46
Highlights
- Barrick Gold stock saw revenue decline 11% to $3.3 billion, but gross profit rose 23% to $90 million in Q1 2027.
- Operating cash outflow reached $639 million, reversing from a $195 million inflow a year earlier, with recent acquisitions broadening its business scope.
- ABX/CAD stock shows bullish short- and medium-term technical signals with high volatility and is expected to trade between C$53.42 and C$58.86 in coming days.
Liquidity pressures rise as profit improves and acquisitions expand scope
Barrick Gold reported mixed fiscal Q1 2027 results, featuring an 11% decline in revenue to $3.3 billion, but a 23% rise in gross profit to $90 million and a 22% increase in non-GAAP EBITDA. The company recorded a $639 million operating cash outflow during the quarter compared to a $195 million inflow in the previous year, signaling a notable shift in liquidity and financial positioning. Additionally, recent acquisitions of Monex, Sunshine Mint, and SMI over the last 12 months expanded its business scope and may influence the medium-term operating profile.
Buy signals persist as price straddles major technical boundaries
Key technical levels for ABX include the MA-20 and MA-50, both of which the price is currently above, while remaining below the MA-200. The Ichimoku Kijun stands at C$54.9, providing immediate support. On the indicator front, MACD and ADX both signal a Buy condition, while RSI, Stochastic RSI, and CCI remain neutral, indicating no significant momentum extremes. Bull/Bear Power is at 1.14, reflecting buyer dominance intraday, while the Awesome Oscillator is neutral and not reinforcing recent momentum.
Consolidation risk rises as trading range guides near-term outlook
Over the next several trading sessions, ABX is expected to fluctuate within a range from C$53.42 to C$58.86 based on typical volatility. The baseline scenario anticipates price consolidation between these bounds. If resistance is breached to the upside, a further rally could develop, while a decline below immediate support may lead to additional downward movement.
Earlier, analysts noted that Barrick Gold's technical outlook was defined by bullish signals tempered by overbought risks, with traders advised to monitor key levels for breakout or breakdown cues. The current analysis adds a new dimension by highlighting recent acquisitions and evolving liquidity conditions, making the C$53.42 support and C$58.86 resistance levels especially important for tracking potential momentum shifts in the sessions ahead.






Latest Barrick Gold News




-
 Afghanistan
-
 Albania
-
 Algeria
-
 Angola
-
 Argentina
-
 Armenia
-
 Australia
-
 Austria
-
 Azerbaijan
-
 Bahamas
-
 Bahrain
-
 Bangladesh
-
 Belarus
-
 Belgium
-
 Bolivia
-
 Botswana
-
 Brazil
-
 Brunei
-
 Bulgaria
-
 Cambodia
-
 Cameroon
-
 Canada
-
 Chile
-
 China
-
 Colombia
-
 Congo
-
 Costa Rica
-
 Cote d'Ivoire
-
 Croatia
-
 Cuba
-
 Cyprus
-
 Czechia
-
 DR Congo
-
 Denmark
-
 Dominican Republic
-
 Ecuador
-
 Egypt
-
 El Salvador
-
 Estonia
-
 Eswatini
-
 Ethiopia
-
 Finland
-
 France
-
 Georgia
-
 Germany
-
 Ghana
-
 Greece
-
 Haiti
-
 Hong Kong
-
 Hungary
-
 India
-
 Indonesia
-
 Iran, Islamic republic
-
 Iraq
-
 Ireland
-
 Israel
-
 Italy
-
 Jamaica
-
 Japan
-
 Jordan
-
 Kazakhstan
-
 Kenya
-
 Korea
-
 Kuwait
-
 Kyrgyzstan
-
 Laos
-
 Latvia
-
 Lebanon
-
 Lesotho
-
 Libya
-
 Lithuania
-
 Luxembourg
-
 Madagascar
-
 Malaysia
-
 Malta
-
 Mauritius
-
 Mexico
-
 Moldova
-
 Mongolia
-
 Montenegro
-
 Morocco
-
 Mozambique
-
 Myanmar
-
 Namibia
-
 Nepal
-
 Netherlands
-
 New Zealand
-
 Nigeria
-
 North Macedonia
-
 Norway
-
 Oman
-
 Pakistan
-
 Palestine
-
 Panama
-
 Papua New Guinea
-
 Paraguay
-
 Peru
-
 Philippines
-
 Poland
-
 Portugal
-
 Puerto Rico
-
 Qatar
-
 Reunion
-
 Romania
-
 Rwanda
-
 Saudi Arabia
-
 Serbia
-
 Singapore
-
 Slovakia
-
 Slovenia
-
 Somalia
-
 South Africa
-
 Spain
-
 Sri Lanka
-
 Sweden
-
 Switzerland
-
 Syria
-
 Taiwan
-
 Tajikistan
-
 Tanzania
-
 Thailand
-
 Trinidad and Tobago
-
 Tunisia
-
 Turkey
-
 UAE
-
 Uganda
-
 Ukraine
-
 United Kingdom
-
United States
-
 Uruguay
-
 Uzbekistan
-
 Venezuela
-
 Vietnam
-
 Yemen
-
 Zambia
-
 Zimbabwe
- Forex
- Crypto












