

Can strong quarterly profit spark further gains for Barrick Gold stock?

Barrick Gold (ABX) stock is trading at C$57.27, up 2.14% on the day. The price sits above its key short- and medium-term moving averages, with notable upward momentum over the session.
 57.60
57.84
Highlights
- Barrick Gold reported a net income of $1.6 million for Q1 fiscal 2027, reversing a net loss one year earlier.
- Revenue fell 11% to $3.265 billion, but adjusted core figures rose 51% and gross profit increased 23% to $89.6 million.
- Shares closed at C$57.27 with short- and medium-term bullish momentum, but overbought technical readings signal possible short-term correction within a C$54.77 to C$59.77 range.
Net profit rebound and special dividend drive renewed buying
Barrick Gold reported a net income of $1.6 million in the first quarter of fiscal 2027, a marked turnaround from a net loss a year earlier and a key driver of buying interest in the shares. While revenue declined 11% year-over-year to $3.265 billion, the core underlying figure rose 51% after adjusting for forward sales, illustrating operational strength and improved sales dynamics. Gross profit also increased by 23% to $89.6 million, pointing to stronger cost discipline, and Barrick Gold paid a total of $35.1 million in dividends—including a substantial special dividend—further attracting yield-focused investors. The company also sold 463,000 ounces of gold and 14 million ounces of silver during the quarter, contributing to a positive market response.
Bullish signals and overbought risks as key levels hold
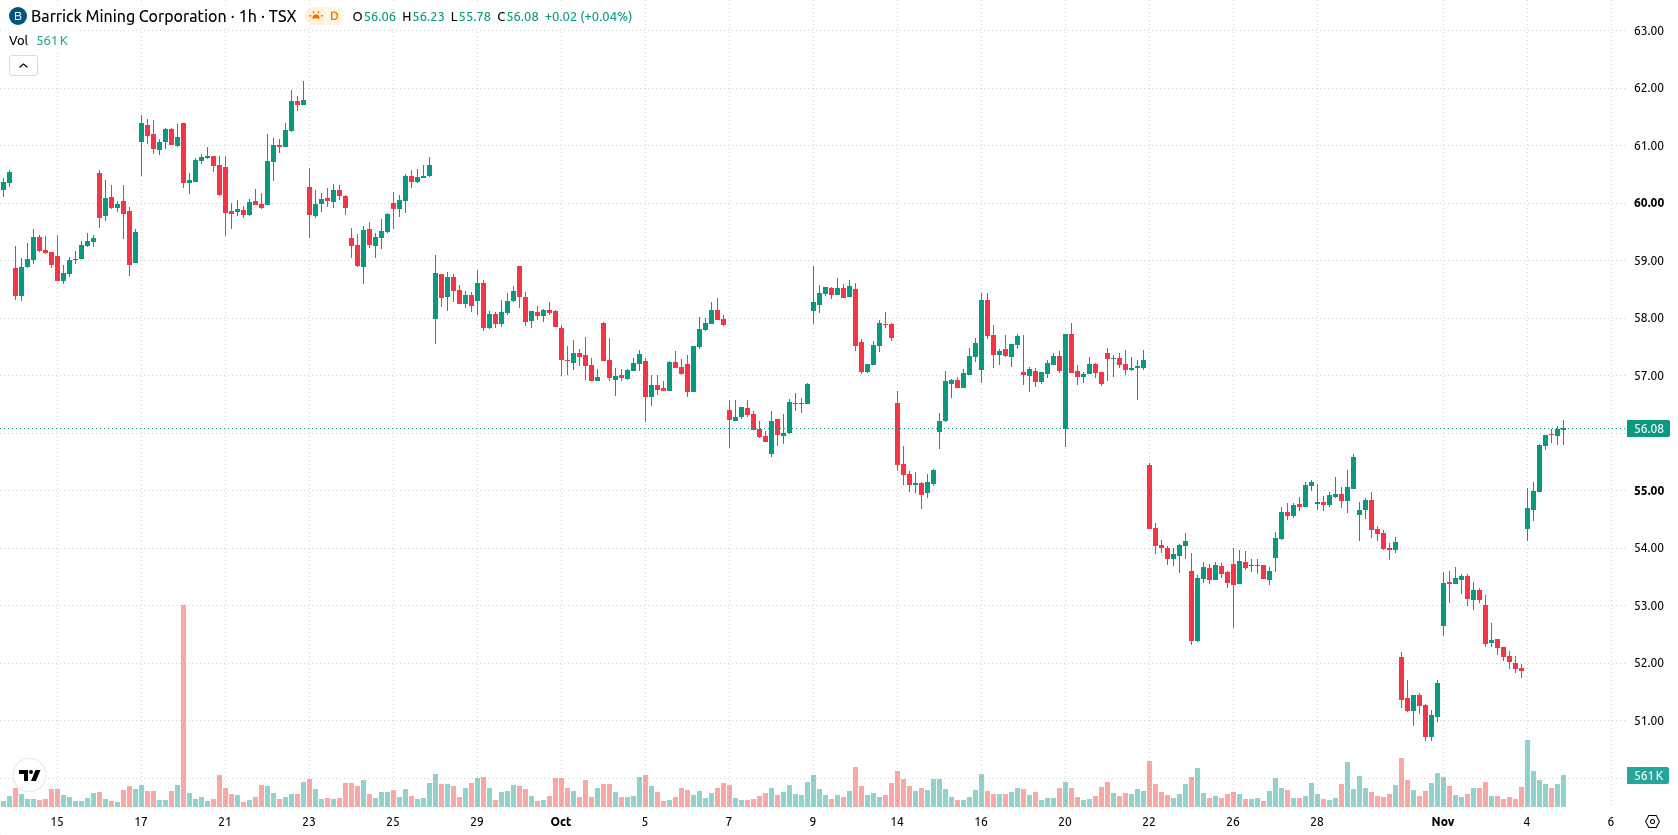
On the hourly chart, ABX is trading above the MA-20 at C$53.72 and the MA-50 at C$53.76, while remaining below the MA-200 at C$58.34. The Ichimoku Kijun line at C$53.43 stands as immediate support. MACD and ADX are both in buy mode, confirming the current bullish drive. However, RSI at 71.62, Stoch RSI at 100, and CCI at 120.04 all sit in overbought territory, signaling the risk of a short-term pullback despite prevailing positive momentum. Bull/Bear Power reads 1.61, revealing continued intraday buyer dominance, and the Awesome Oscillator supports the upward move, although overbought oscillators suggest caution is warranted in the immediate term.
Volatility band defines upside potential amid breakout risks
Over the next several days, ABX is likely to fluctuate within a C$54.77 to C$59.77 volatility band relative to current levels. There is a 67% probability of further upside continuation, with a 33% chance of a move lower. Should price break out above C$59.77, a stronger bullish run could follow; conversely, a decline below C$54.77 would point to renewed selling pressure and potential short-term weakness.
Earlier, analysts noted that Barrick Gold was consolidating within a defined range, facing technical headwinds that limited near-term upside. The latest quarterly results and ongoing positive momentum reinforce this cautious outlook, with traders advised to monitor the C$54.77 and C$59.77 volatility band for key breakout or breakdown signals in the days ahead.






Latest Barrick Gold News




-
 Afghanistan
-
 Albania
-
 Algeria
-
 Angola
-
 Argentina
-
 Armenia
-
 Australia
-
 Austria
-
 Azerbaijan
-
 Bahamas
-
 Bahrain
-
 Bangladesh
-
 Belarus
-
 Belgium
-
 Bolivia
-
 Botswana
-
 Brazil
-
 Brunei
-
 Bulgaria
-
 Cambodia
-
 Cameroon
-
 Canada
-
 Chile
-
 China
-
 Colombia
-
 Congo
-
 Costa Rica
-
 Cote d'Ivoire
-
 Croatia
-
 Cuba
-
 Cyprus
-
 Czechia
-
 DR Congo
-
 Denmark
-
 Dominican Republic
-
 Ecuador
-
 Egypt
-
 El Salvador
-
 Estonia
-
 Eswatini
-
 Ethiopia
-
 Finland
-
 France
-
 Georgia
-
 Germany
-
 Ghana
-
 Greece
-
 Haiti
-
 Hong Kong
-
 Hungary
-
 India
-
 Indonesia
-
 Iran, Islamic republic
-
 Iraq
-
 Ireland
-
 Israel
-
 Italy
-
 Jamaica
-
 Japan
-
 Jordan
-
 Kazakhstan
-
 Kenya
-
 Korea
-
 Kuwait
-
 Kyrgyzstan
-
 Laos
-
 Latvia
-
 Lebanon
-
 Lesotho
-
 Libya
-
 Lithuania
-
 Luxembourg
-
 Madagascar
-
 Malaysia
-
 Malta
-
 Mauritius
-
 Mexico
-
 Moldova
-
 Mongolia
-
 Montenegro
-
 Morocco
-
 Mozambique
-
 Myanmar
-
 Namibia
-
 Nepal
-
 Netherlands
-
 New Zealand
-
 Nigeria
-
 North Macedonia
-
 Norway
-
 Oman
-
 Pakistan
-
 Palestine
-
 Panama
-
 Papua New Guinea
-
 Paraguay
-
 Peru
-
 Philippines
-
 Poland
-
 Portugal
-
 Puerto Rico
-
 Qatar
-
 Reunion
-
 Romania
-
 Rwanda
-
 Saudi Arabia
-
 Serbia
-
 Singapore
-
 Slovakia
-
 Slovenia
-
 Somalia
-
 South Africa
-
 Spain
-
 Sri Lanka
-
 Sweden
-
 Switzerland
-
 Syria
-
 Taiwan
-
 Tajikistan
-
 Tanzania
-
 Thailand
-
 Trinidad and Tobago
-
 Tunisia
-
 Turkey
-
 UAE
-
 Uganda
-
 Ukraine
-
 United Kingdom
-
United States
-
 Uruguay
-
 Uzbekistan
-
 Venezuela
-
 Vietnam
-
 Yemen
-
 Zambia
-
 Zimbabwe
- Forex
- Crypto












