

Advanced Micro Devices reports $1.1B warrant charge: AMD under seller pressure

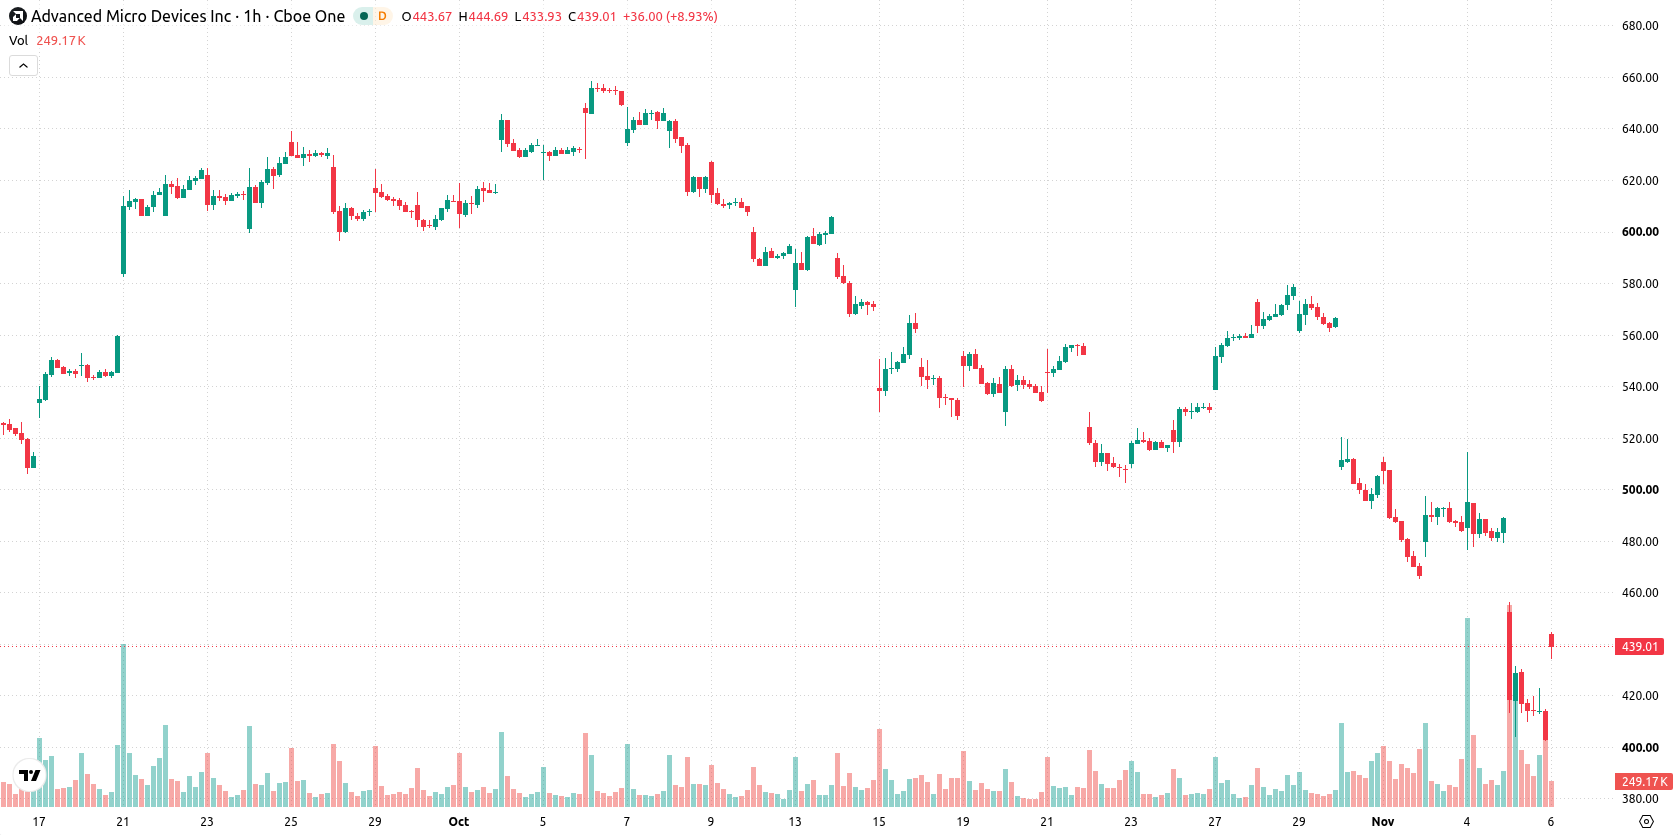
AMD (AMD) stock is trading at $402.63, marking a sharp loss of 17.63% for the session. The share price sits below its key short-, medium-, and long-term moving averages, highlighting persistent downward momentum.
 459.80
508.16
Highlights
- AMD reported third-quarter 2026 revenue of $13.38 billion and non-GAAP EPS of $2.09, with data center revenue up 97% year over year to $8.55 billion.
- Quarterly profit included a $1.1 billion charge from warrants issued to OpenAI and Meta as AMD began shipments of Instinct MI450 accelerators.
- Shares of AMD are trading below key moving averages with momentum indicators firmly negative, projecting a high probability of further downside toward $350.3 support in the next 2 to 3 days.
Robust AI sales offset by warrant charges as profitability dips
Advanced Micro Devices reported third-quarter 2026 revenue of $13.38 billion, alongside non-GAAP EPS of $2.09 and data center revenue of $8.55 billion, representing a 97% annual increase, according to 247wallst. While the jump in data center sales signals growing strength in its AI-focused segments, quarterly profitability was affected by a $1.1 billion charge related to warrants issued to OpenAI and Meta as AMD began shipping its Instinct MI450 accelerators, as reported by Ibtimes. These developments highlight robust underlying sales momentum but introduce near-term accounting impacts that have tempered headline results.
Oversold signals and strong downside momentum as resistance holds
On the technical front, AMD is trading below its MA-20 and MA-50 on the working timeframe, as well as below the MA-200 on the daily chart. Immediate resistance is outlined by the Ichimoku Kijun at $458.36, while support is noted at $350.3. Momentum indicators remain negative, with MACD and ADX showing strong downside trends. RSI, Stochastic RSI, and CCI are all in oversold territory, indicating a potential for seller exhaustion, although no reversal signal is present. Bull/Bear Power is deeply negative, confirming seller dominance intraday, while the Awesome Oscillator is neutral and does not reinforce the current trend.
Wide-range trading expected amid elevated volatility and downside risk
In the short term, AMD is expected to fluctuate within a broad range between $350.3 and $454.96, reflecting the current unusually high volatility. The likelihood of a sustained upward move remains low, with downside risk elevated. The baseline scenario sees AMD consolidating in a wide sideways channel; a breakout above $458.36 resistance would be necessary to signal a bullish reversal, while a close below $350.3 would likely result in renewed selling pressure.
Earlier, analysts noted that AMD's stock remained vulnerable to heightened volatility and political risks despite corporate advances in AI and quantum computing. With the latest earnings now highlighting strong data center growth but persistent technical weakness, traders should monitor the $350.3 support and $458.36 resistance for signs of a potential breakout from the current consolidation zone.











-
 Afghanistan
-
 Albania
-
 Algeria
-
 Angola
-
 Argentina
-
 Armenia
-
 Australia
-
 Austria
-
 Azerbaijan
-
 Bahamas
-
 Bahrain
-
 Bangladesh
-
 Belarus
-
 Belgium
-
 Bolivia
-
 Botswana
-
 Brazil
-
 Brunei
-
 Bulgaria
-
 Cambodia
-
 Cameroon
-
 Canada
-
 Chile
-
 China
-
 Colombia
-
 Congo
-
 Costa Rica
-
 Cote d'Ivoire
-
 Croatia
-
 Cuba
-
 Cyprus
-
 Czechia
-
 DR Congo
-
 Denmark
-
 Dominican Republic
-
 Ecuador
-
 Egypt
-
 El Salvador
-
 Estonia
-
 Eswatini
-
 Ethiopia
-
 Finland
-
 France
-
 Georgia
-
 Germany
-
 Ghana
-
 Greece
-
 Haiti
-
 Hong Kong
-
 Hungary
-
 India
-
 Indonesia
-
 Iran, Islamic republic
-
 Iraq
-
 Ireland
-
 Israel
-
 Italy
-
 Jamaica
-
 Japan
-
 Jordan
-
 Kazakhstan
-
 Kenya
-
 Korea
-
 Kuwait
-
 Kyrgyzstan
-
 Laos
-
 Latvia
-
 Lebanon
-
 Lesotho
-
 Libya
-
 Lithuania
-
 Luxembourg
-
 Madagascar
-
 Malaysia
-
 Malta
-
 Mauritius
-
 Mexico
-
 Moldova
-
 Mongolia
-
 Montenegro
-
 Morocco
-
 Mozambique
-
 Myanmar
-
 Namibia
-
 Nepal
-
 Netherlands
-
 New Zealand
-
 Nigeria
-
 North Macedonia
-
 Norway
-
 Oman
-
 Pakistan
-
 Palestine
-
 Panama
-
 Papua New Guinea
-
 Paraguay
-
 Peru
-
 Philippines
-
 Poland
-
 Portugal
-
 Puerto Rico
-
 Qatar
-
 Reunion
-
 Romania
-
 Rwanda
-
 Saudi Arabia
-
 Serbia
-
 Singapore
-
 Slovakia
-
 Slovenia
-
 Somalia
-
 South Africa
-
 Spain
-
 Sri Lanka
-
 Sweden
-
 Switzerland
-
 Syria
-
 Taiwan
-
 Tajikistan
-
 Tanzania
-
 Thailand
-
 Trinidad and Tobago
-
 Tunisia
-
 Turkey
-
 UAE
-
 Uganda
-
 Ukraine
-
 United Kingdom
-
United States
-
 Uruguay
-
 Uzbekistan
-
 Venezuela
-
 Vietnam
-
 Yemen
-
 Zambia
-
 Zimbabwe
- Forex
- Crypto












