

QCOM jumps as upward price move follows institutional buying and momentum burst

Qualcomm (QCOM) stock is trading at $165.32, up 5.38% on the day. The price sits above its short-term moving averages, signaling a burst of momentum within a broader mixed trend context.
 167.42
173.73
Highlights
- Qualcomm reported fiscal fourth-quarter revenue of $10.4 billion and adjusted EPS of $2.17, with a 26% drop in handset chip sales and lower guidance for the next quarter.
- The company returned $2 billion to shareholders via dividends and buybacks, and automotive chip revenue reached $1.99 billion, with $112.7 million of shares bought by 41 ETFs on November 3, 2026.
- Shares of Qualcomm rose 5.38% to $165.32 but remain below key long-term averages, with technical indicators signaling weak momentum and a high probability of trading between $154.18 and $176.46.
Revenue shortfall and guidance miss as diversification and buybacks intensify
Qualcomm's fiscal fourth-quarter results, reported by Qz, revealed $10.4 billion in revenue and adjusted EPS of $2.17, while a sharp 26% drop in handset chip revenue and disappointing next-quarter guidance highlighted ongoing challenges in its core smartphone business. In response, the company moved to return $2 billion to shareholders through dividends and share repurchases, as noted by Benzinga, affirming its commitment to direct capital returns even amid near-term headwinds. Automotive chip revenue for the quarter reached $1.99 billion, signaling growth in diversification efforts, and institutional buying remained active, with 41 ETFs collectively adding $112.7 million of Qualcomm shares on November 3, 2026, according to Yahoo Finance.
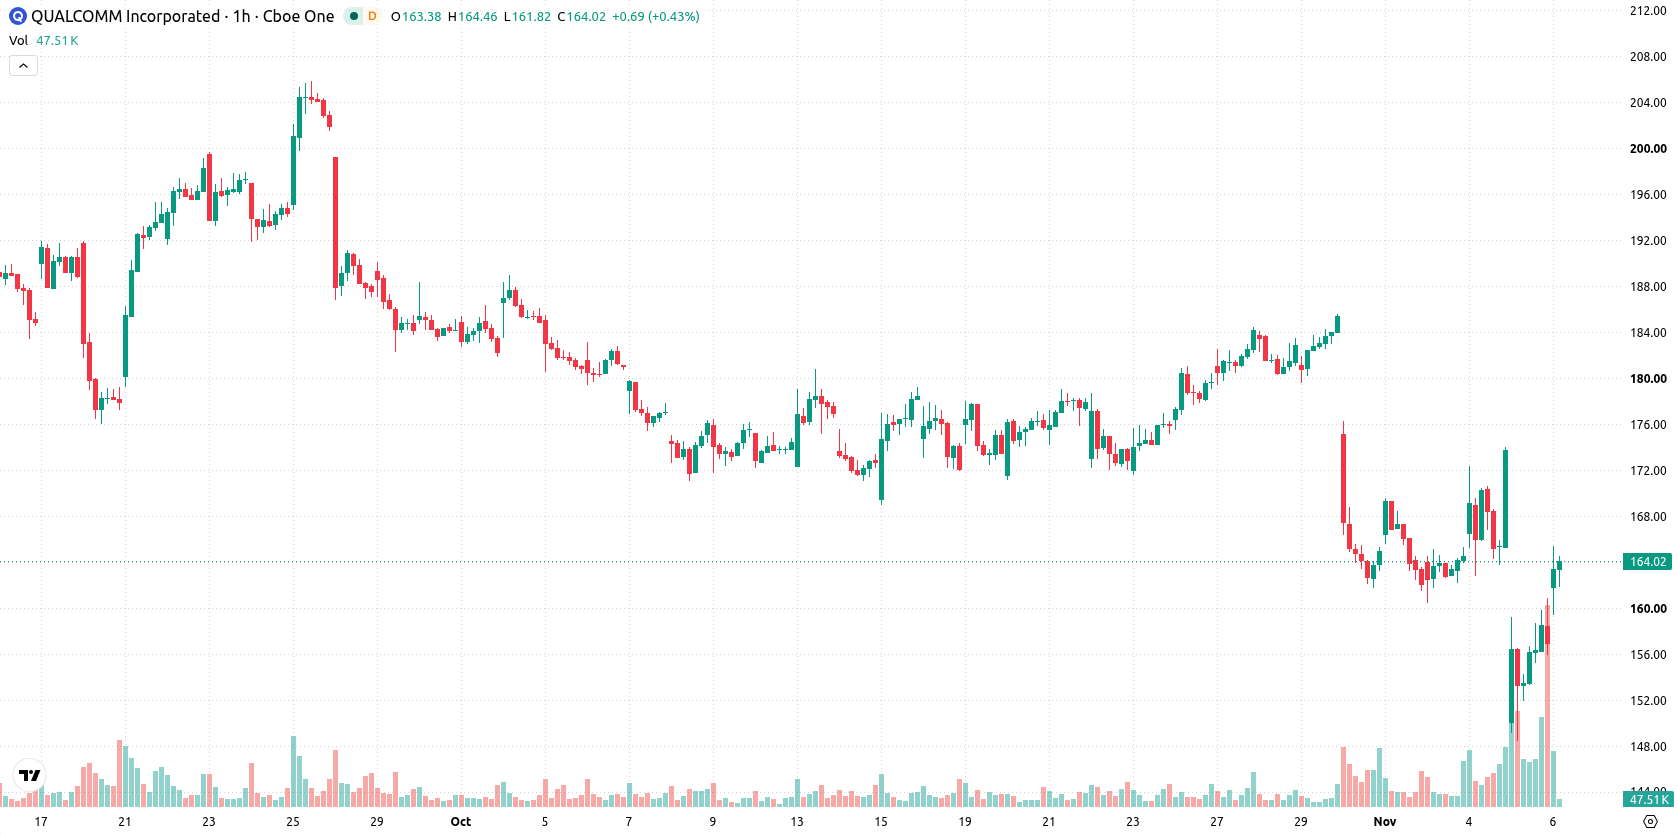
Resistance limits gains as momentum signals remain mixed
Technically, QCOM price action shows specific levels of interest: it is above the MA-20 at $162.53, but remains capped below the MA-50 at $169.26 and MA-200 at $169.65. The Ichimoku Kijun at $161.13 establishes a key support area. Momentum indicators are mixed—MACD signals a sell setup, while ADX points to weak directional strength. Oscillators including RSI, Stochastic RSI, and CCI are neutral, indicating an absence of extreme conditions. Bull/Bear Power is positive at 0.96, reflecting current intraday buyer dominance, but the Awesome Oscillator is neutral and does not confirm the short-term move.
Downside risk prevails as sideways trend likely to persist
Over the next few trading days, QCOM is expected to fluctuate within a volatility band of $154.18 to $176.46. The probability of a pronounced upside move is very low, with downside risk more prominent. The baseline forecast calls for sideways trading within this range, with a potential bullish scenario unlocked by a strong move above resistance and a bearish scenario triggered if immediate support is breached, potentially sending price toward the lower boundary.
Previously it was reported that Qualcomm faced persistent technical and fundamental pressures as weakness in its core handset chip division weighed on the stock's outlook. With the current rebound constrained by mixed momentum signals and both resistance and support levels in play, traders should monitor for a decisive break that could set the direction beyond the established $154.18 to $176.46 trading range.






Latest Qualcomm News




-
 Afghanistan
-
 Albania
-
 Algeria
-
 Angola
-
 Argentina
-
 Armenia
-
 Australia
-
 Austria
-
 Azerbaijan
-
 Bahamas
-
 Bahrain
-
 Bangladesh
-
 Belarus
-
 Belgium
-
 Bolivia
-
 Botswana
-
 Brazil
-
 Brunei
-
 Bulgaria
-
 Cambodia
-
 Cameroon
-
 Canada
-
 Chile
-
 China
-
 Colombia
-
 Congo
-
 Costa Rica
-
 Cote d'Ivoire
-
 Croatia
-
 Cuba
-
 Cyprus
-
 Czechia
-
 DR Congo
-
 Denmark
-
 Dominican Republic
-
 Ecuador
-
 Egypt
-
 El Salvador
-
 Estonia
-
 Eswatini
-
 Ethiopia
-
 Finland
-
 France
-
 Georgia
-
 Germany
-
 Ghana
-
 Greece
-
 Haiti
-
 Hong Kong
-
 Hungary
-
 India
-
 Indonesia
-
 Iran, Islamic republic
-
 Iraq
-
 Ireland
-
 Israel
-
 Italy
-
 Jamaica
-
 Japan
-
 Jordan
-
 Kazakhstan
-
 Kenya
-
 Korea
-
 Kuwait
-
 Kyrgyzstan
-
 Laos
-
 Latvia
-
 Lebanon
-
 Lesotho
-
 Libya
-
 Lithuania
-
 Luxembourg
-
 Madagascar
-
 Malaysia
-
 Malta
-
 Mauritius
-
 Mexico
-
 Moldova
-
 Mongolia
-
 Montenegro
-
 Morocco
-
 Mozambique
-
 Myanmar
-
 Namibia
-
 Nepal
-
 Netherlands
-
 New Zealand
-
 Nigeria
-
 North Macedonia
-
 Norway
-
 Oman
-
 Pakistan
-
 Palestine
-
 Panama
-
 Papua New Guinea
-
 Paraguay
-
 Peru
-
 Philippines
-
 Poland
-
 Portugal
-
 Puerto Rico
-
 Qatar
-
 Reunion
-
 Romania
-
 Rwanda
-
 Saudi Arabia
-
 Serbia
-
 Singapore
-
 Slovakia
-
 Slovenia
-
 Somalia
-
 South Africa
-
 Spain
-
 Sri Lanka
-
 Sweden
-
 Switzerland
-
 Syria
-
 Taiwan
-
 Tajikistan
-
 Tanzania
-
 Thailand
-
 Trinidad and Tobago
-
 Tunisia
-
 Turkey
-
 UAE
-
 Uganda
-
 Ukraine
-
 United Kingdom
-
United States
-
 Uruguay
-
 Uzbekistan
-
 Venezuela
-
 Vietnam
-
 Yemen
-
 Zambia
-
 Zimbabwe
- Forex
- Crypto












