

Will Shell stock extend losses amid sustained seller pressure?

Shell (SHEL) stock is trading at 3,720, down 1.68% on the day. The price is below its key short- and medium-term moving averages, but remains above longer-term trend markers.
 3706.00
3937.50
Highlights
- Shell shares fell below their fifty day moving average, a technical breach often followed by further price weakness.
- Increased sell pressure has accompanied the move below this key technical level, with downside momentum prevailing in the current session.
- Bearish technical readings dominate, with price at GBX 3,720 and a likely trading range of GBX 3,559 to 3,881 over the coming sessions.
Downside pressure amplified as breach of MA-50 triggers selling
Shell shares recently crossed below their fifty day moving average, a breach that tends to be interpreted by investors as a signal of continued weakness, according to Themarketsdaily. Such a move can lead to increased downside momentum, as technical traders react to the violation of this widely tracked level. This shift in positioning may explain the heightened sell pressure observed in the current session.
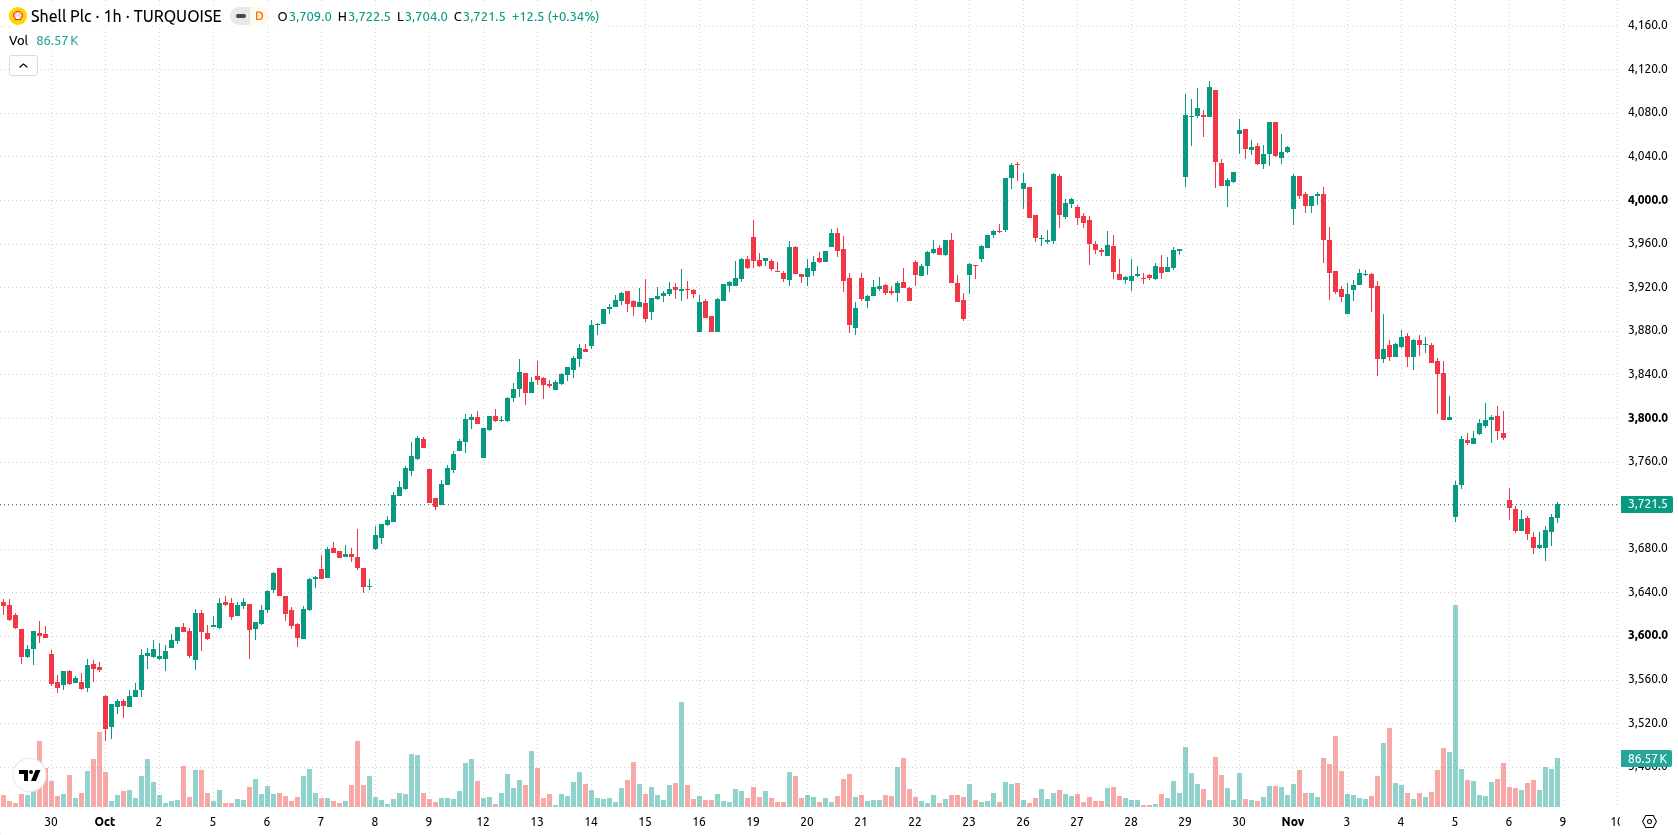
Bearish momentum persists as price faces resistance and indicator divergences
SHEL is trading below both its MA-20 (3,747) and MA-50 (3,860), reflecting ongoing technical weakness, but remains above the MA-200 at 3,310. The Ichimoku Kijun at 3,771 acts as immediate resistance. Momentum indicators are skewed bearish: MACD shows a Strong Sell, and ADX also gives a Sell signal. RSI (36.48) and CCI (−48.8) are neutral, while Stoch RSI is overbought at 95.37, indicating possible short-term correction risk. Bull/Bear Power remains negative at −4.19, and the Awesome Oscillator is neutral. There is a divergence between strong intraday seller dominance and the overbought Stoch RSI reading, combined with a close near the day's high on moderate volatility.
Sideways bias persists as downside risk outweighs rebound odds
Over the short term, Shell's price is expected to trade within a volatility band of 3,559 to 3,881. Downside movement appears more likely, with a 68% probability versus 32% for an upward move. The baseline scenario is for sideways consolidation within this corridor; a bullish outcome may develop only if the price surpasses the 3,771 resistance, while a break below 3,559 support would reinforce a bearish outlook.
Earlier, analysts noted that Shell was reshaping its retail strategy by scaling back its global petrol station network and refocusing capital on upstream oil and gas operations. Current technical signals point to ongoing downside risk, making 3,559 a critical support level to monitor as potential further weakness could emerge if this threshold is breached.










-
 Afghanistan
-
 Albania
-
 Algeria
-
 Angola
-
 Argentina
-
 Armenia
-
 Australia
-
 Austria
-
 Azerbaijan
-
 Bahamas
-
 Bahrain
-
 Bangladesh
-
 Belarus
-
 Belgium
-
 Bolivia
-
 Botswana
-
 Brazil
-
 Brunei
-
 Bulgaria
-
 Cambodia
-
 Cameroon
-
 Canada
-
 Chile
-
 China
-
 Colombia
-
 Congo
-
 Costa Rica
-
 Cote d'Ivoire
-
 Croatia
-
 Cuba
-
 Cyprus
-
 Czechia
-
 DR Congo
-
 Denmark
-
 Dominican Republic
-
 Ecuador
-
 Egypt
-
 El Salvador
-
 Estonia
-
 Eswatini
-
 Ethiopia
-
 Finland
-
 France
-
 Georgia
-
 Germany
-
 Ghana
-
 Greece
-
 Haiti
-
 Hong Kong
-
 Hungary
-
 India
-
 Indonesia
-
 Iran, Islamic republic
-
 Iraq
-
 Ireland
-
 Israel
-
 Italy
-
 Jamaica
-
 Japan
-
 Jordan
-
 Kazakhstan
-
 Kenya
-
 Korea
-
 Kuwait
-
 Kyrgyzstan
-
 Laos
-
 Latvia
-
 Lebanon
-
 Lesotho
-
 Libya
-
 Lithuania
-
 Luxembourg
-
 Madagascar
-
 Malaysia
-
 Malta
-
 Mauritius
-
 Mexico
-
 Moldova
-
 Mongolia
-
 Montenegro
-
 Morocco
-
 Mozambique
-
 Myanmar
-
 Namibia
-
 Nepal
-
 Netherlands
-
 New Zealand
-
 Nigeria
-
 North Macedonia
-
 Norway
-
 Oman
-
 Pakistan
-
 Palestine
-
 Panama
-
 Papua New Guinea
-
 Paraguay
-
 Peru
-
 Philippines
-
 Poland
-
 Portugal
-
 Puerto Rico
-
 Qatar
-
 Reunion
-
 Romania
-
 Rwanda
-
 Saudi Arabia
-
 Serbia
-
 Singapore
-
 Slovakia
-
 Slovenia
-
 Somalia
-
 South Africa
-
 Spain
-
 Sri Lanka
-
 Sweden
-
 Switzerland
-
 Syria
-
 Taiwan
-
 Tajikistan
-
 Tanzania
-
 Thailand
-
 Trinidad and Tobago
-
 Tunisia
-
 Turkey
-
 UAE
-
 Uganda
-
 Ukraine
-
 United Kingdom
-
United States
-
 Uruguay
-
 Uzbekistan
-
 Venezuela
-
 Vietnam
-
 Yemen
-
 Zambia
-
 Zimbabwe
- Forex
- Crypto












