

Will BT Group stock stabilize amid seller dominance and heightened volatility?

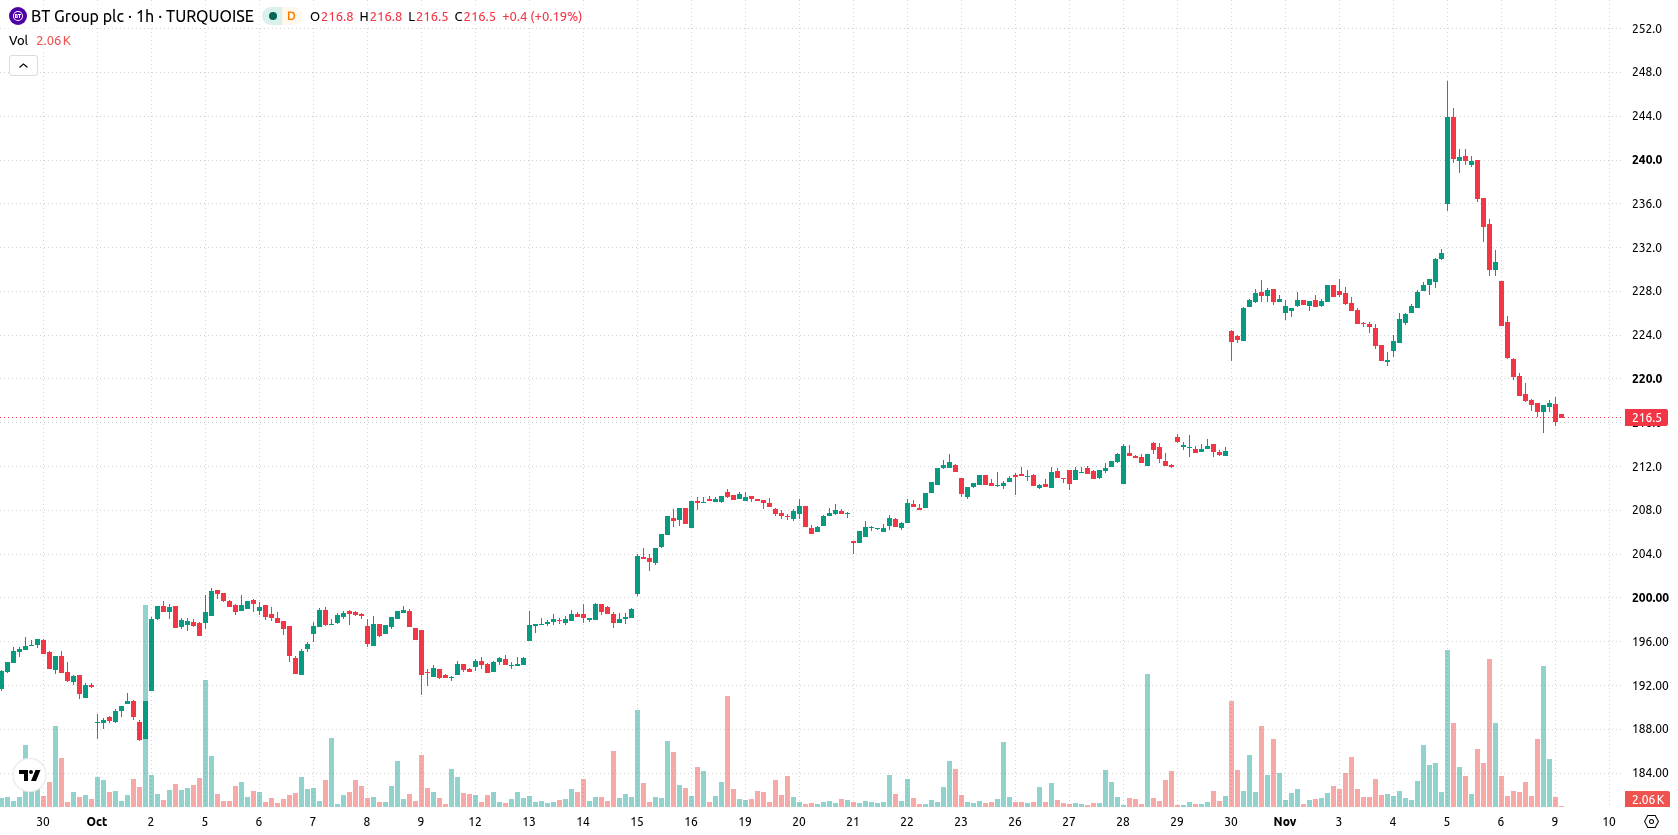
BT Group (BT-A) stock is trading at GBX217.8, down 6.04% on the session. The price is positioned below its short- and medium-term moving averages but remains above its long-term moving average support.
 218.90
247.30
Highlights
- BT Group reported its first rise in revenue in two and a half years, up 1% to £8.75 billion for the half year.
- Pre-tax profit increased 12% and the interim dividend was raised 2%, with full-year guidance maintained and TalkTalk acquisition under regulatory review.
- Shares of BT Group dropped 6.04% to GBX217.8, trading below key moving averages with strong selling pressure and a short-term range of GBX203.31 to GBX232.29 expected.
Profit growth and dividend bump counterbalanced by market skepticism
BT Group posted its first rise in total revenue in two and a half years, as revenue increased 1% to £8.75 billion and adjusted EBITDA rose 1% to £4.1 billion for the six months ending September 30, 2026, according to Americanbankingnews. The company achieved a 12% increase in pre-tax profit for the first half and maintained its full-year guidance, reflecting improved profitability and a steady outlook. Alongside these results, BT Group raised its interim dividend by 2% and continued to expand its 5G+ coverage, while its acquisition of TalkTalk remained under regulatory review. Recent operational gains have not been enough to offset prevailing market pressure, as reflected in the current trading environment.
Seller momentum builds as key resistance and volatility align
Technically, the stock remains below the MA-20 and MA-50 but holds above the MA-200, with immediate resistance found at the Ichimoku Kijun level of GBX231.1. The MACD and ADX both show selling momentum, while RSI and CCI are neutral. Stoch RSI sits in the oversold zone, signaling a possible short-lived rebound as downside momentum continues. Bull/Bear Power is negative and the Awesome Oscillator also points downward, reinforcing intraday seller dominance. Price action shows a gap down and high volatility near session lows, with several oscillators indicating caution despite the overall bearish momentum.
Downside risk dominates as rebound probabilities diminish
In the short term, the expected trading range is GBX203.31 to GBX232.29. Scenario analysis indicates a 30% chance of a technical rebound and a 70% probability of further downside, lowering the likelihood of a near-term recovery. The baseline scenario is price consolidation within this band, while a move above immediate resistance could trigger a bullish reversal. A sustained breakdown below GBX203.31 would suggest a continuation of the bearish trend.
Earlier, analysts noted that despite BT Group’s notable operational improvements, macroeconomic and external pressures continued to weigh on the stock’s outlook. With technical signals now skewed further to the downside, the prevailing risk remains a sustained breakdown below GBX203.31, which could reinforce the bearish scenario in the near term.






Latest BT Group News




-
 Afghanistan
-
 Albania
-
 Algeria
-
 Angola
-
 Argentina
-
 Armenia
-
 Australia
-
 Austria
-
 Azerbaijan
-
 Bahamas
-
 Bahrain
-
 Bangladesh
-
 Belarus
-
 Belgium
-
 Bolivia
-
 Botswana
-
 Brazil
-
 Brunei
-
 Bulgaria
-
 Cambodia
-
 Cameroon
-
 Canada
-
 Chile
-
 China
-
 Colombia
-
 Congo
-
 Costa Rica
-
 Cote d'Ivoire
-
 Croatia
-
 Cuba
-
 Cyprus
-
 Czechia
-
 DR Congo
-
 Denmark
-
 Dominican Republic
-
 Ecuador
-
 Egypt
-
 El Salvador
-
 Estonia
-
 Eswatini
-
 Ethiopia
-
 Finland
-
 France
-
 Georgia
-
 Germany
-
 Ghana
-
 Greece
-
 Haiti
-
 Hong Kong
-
 Hungary
-
 India
-
 Indonesia
-
 Iran, Islamic republic
-
 Iraq
-
 Ireland
-
 Israel
-
 Italy
-
 Jamaica
-
 Japan
-
 Jordan
-
 Kazakhstan
-
 Kenya
-
 Korea
-
 Kuwait
-
 Kyrgyzstan
-
 Laos
-
 Latvia
-
 Lebanon
-
 Lesotho
-
 Libya
-
 Lithuania
-
 Luxembourg
-
 Madagascar
-
 Malaysia
-
 Malta
-
 Mauritius
-
 Mexico
-
 Moldova
-
 Mongolia
-
 Montenegro
-
 Morocco
-
 Mozambique
-
 Myanmar
-
 Namibia
-
 Nepal
-
 Netherlands
-
 New Zealand
-
 Nigeria
-
 North Macedonia
-
 Norway
-
 Oman
-
 Pakistan
-
 Palestine
-
 Panama
-
 Papua New Guinea
-
 Paraguay
-
 Peru
-
 Philippines
-
 Poland
-
 Portugal
-
 Puerto Rico
-
 Qatar
-
 Reunion
-
 Romania
-
 Rwanda
-
 Saudi Arabia
-
 Serbia
-
 Singapore
-
 Slovakia
-
 Slovenia
-
 Somalia
-
 South Africa
-
 Spain
-
 Sri Lanka
-
 Sweden
-
 Switzerland
-
 Syria
-
 Taiwan
-
 Tajikistan
-
 Tanzania
-
 Thailand
-
 Trinidad and Tobago
-
 Tunisia
-
 Turkey
-
 UAE
-
 Uganda
-
 Ukraine
-
 United Kingdom
-
United States
-
 Uruguay
-
 Uzbekistan
-
 Venezuela
-
 Vietnam
-
 Yemen
-
 Zambia
-
 Zimbabwe
- Forex
- Crypto












