

MFC climbs as earnings outperformance boosts investor confidence

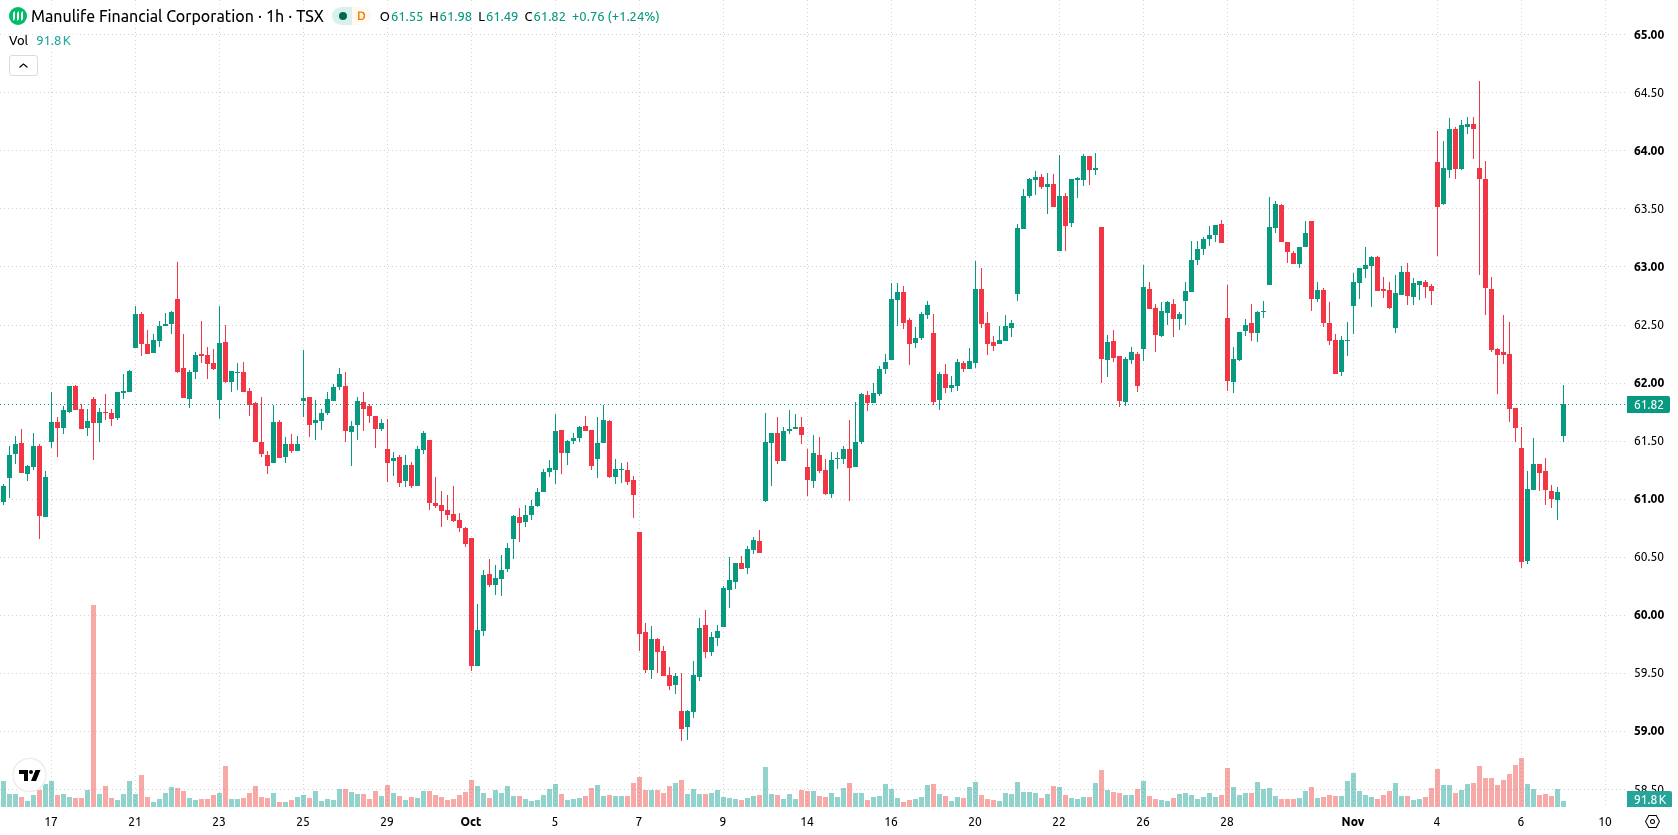
Manulife Financial (MFC) stock is trading at C$61.92 after rising 1.47% on the day. The price is currently positioned below its short- and medium-term moving averages, while still holding above its long-term trend support.
 63.14
63.65
Highlights
- Manulife reported quarterly earnings per share of C$1.24, exceeding the C$1.18 consensus estimate by 5.1%.
- The earnings beat is the main driver of improved market confidence in Manulife's operational resilience.
- Shares of Manulife trade below key short- and medium-term averages, with technical indicators showing bearish momentum and a projected range of C$60.06 to C$63.78 over the next four days.
Earnings beat lifts profitability outlook and drives sentiment shift
Manulife reported earnings per share of C$1.24 for the quarter ended September 30, surpassing the C$1.18 consensus estimate by 5.1%, according to Wealthawesome. This outperformance signaled stronger-than-anticipated profitability, which has improved investor sentiment toward the stock. The earnings result increased market confidence in Manulife's operational resilience and is viewed as the main driver of today's positive move.
Bearish momentum persists with resistance at key technical boundary
The H1 chart shows MFC trading below the MA-20 and MA-50, pointing to ongoing short- and medium-term bearish momentum, while the price remains above the MA-200 on the daily timeframe—indicating long-term support persists. Immediate resistance is found at the Ichimoku Kijun level of C$62.5. Momentum indicators MACD and ADX both confirm a sell condition, whereas RSI, Stoch RSI, and CCI remain in neutral territory, highlighting a lack of extreme conditions. Bull/Bear Power is negative at -0.51, confirming that sellers drive intraday sentiment, while the Awesome Oscillator stays neutral and does not confirm a broader directional trend.
Trading range outlook as volatility hinges on resistance breakout
Over the coming four trading days, MFC is likely to oscillate within the C$60.06–C$63.78 range, reflecting typical volatility centered around the current market structure. A bullish scenario would require a clear break and close above C$62.5 resistance, which could pave the way for a move toward the upper end of the projected range. Conversely, a close below C$60.06 would reinforce downside momentum and is likely to accelerate further declines, as current technical and momentum conditions favor sellers.
Previously it was reported that Manulife Financial's technical setup was under short-term selling pressure despite support from long-term trends and buyback programs. The current analysis strengthens this outlook with fresh earnings data, highlighting C$62.5 as a critical resistance level, and traders should watch for decisive price action above or below this point to signal the next directional move.






Latest Manulife Financial News




-
 Afghanistan
-
 Albania
-
 Algeria
-
 Angola
-
 Argentina
-
 Armenia
-
 Australia
-
 Austria
-
 Azerbaijan
-
 Bahamas
-
 Bahrain
-
 Bangladesh
-
 Belarus
-
 Belgium
-
 Bolivia
-
 Botswana
-
 Brazil
-
 Brunei
-
 Bulgaria
-
 Cambodia
-
 Cameroon
-
 Canada
-
 Chile
-
 China
-
 Colombia
-
 Congo
-
 Costa Rica
-
 Cote d'Ivoire
-
 Croatia
-
 Cuba
-
 Cyprus
-
 Czechia
-
 DR Congo
-
 Denmark
-
 Dominican Republic
-
 Ecuador
-
 Egypt
-
 El Salvador
-
 Estonia
-
 Eswatini
-
 Ethiopia
-
 Finland
-
 France
-
 Georgia
-
 Germany
-
 Ghana
-
 Greece
-
 Haiti
-
 Hong Kong
-
 Hungary
-
 India
-
 Indonesia
-
 Iran, Islamic republic
-
 Iraq
-
 Ireland
-
 Israel
-
 Italy
-
 Jamaica
-
 Japan
-
 Jordan
-
 Kazakhstan
-
 Kenya
-
 Korea
-
 Kuwait
-
 Kyrgyzstan
-
 Laos
-
 Latvia
-
 Lebanon
-
 Lesotho
-
 Libya
-
 Lithuania
-
 Luxembourg
-
 Madagascar
-
 Malaysia
-
 Malta
-
 Mauritius
-
 Mexico
-
 Moldova
-
 Mongolia
-
 Montenegro
-
 Morocco
-
 Mozambique
-
 Myanmar
-
 Namibia
-
 Nepal
-
 Netherlands
-
 New Zealand
-
 Nigeria
-
 North Macedonia
-
 Norway
-
 Oman
-
 Pakistan
-
 Palestine
-
 Panama
-
 Papua New Guinea
-
 Paraguay
-
 Peru
-
 Philippines
-
 Poland
-
 Portugal
-
 Puerto Rico
-
 Qatar
-
 Reunion
-
 Romania
-
 Rwanda
-
 Saudi Arabia
-
 Serbia
-
 Singapore
-
 Slovakia
-
 Slovenia
-
 Somalia
-
 South Africa
-
 Spain
-
 Sri Lanka
-
 Sweden
-
 Switzerland
-
 Syria
-
 Taiwan
-
 Tajikistan
-
 Tanzania
-
 Thailand
-
 Trinidad and Tobago
-
 Tunisia
-
 Turkey
-
 UAE
-
 Uganda
-
 Ukraine
-
 United Kingdom
-
United States
-
 Uruguay
-
 Uzbekistan
-
 Venezuela
-
 Vietnam
-
 Yemen
-
 Zambia
-
 Zimbabwe
- Forex
- Crypto












