


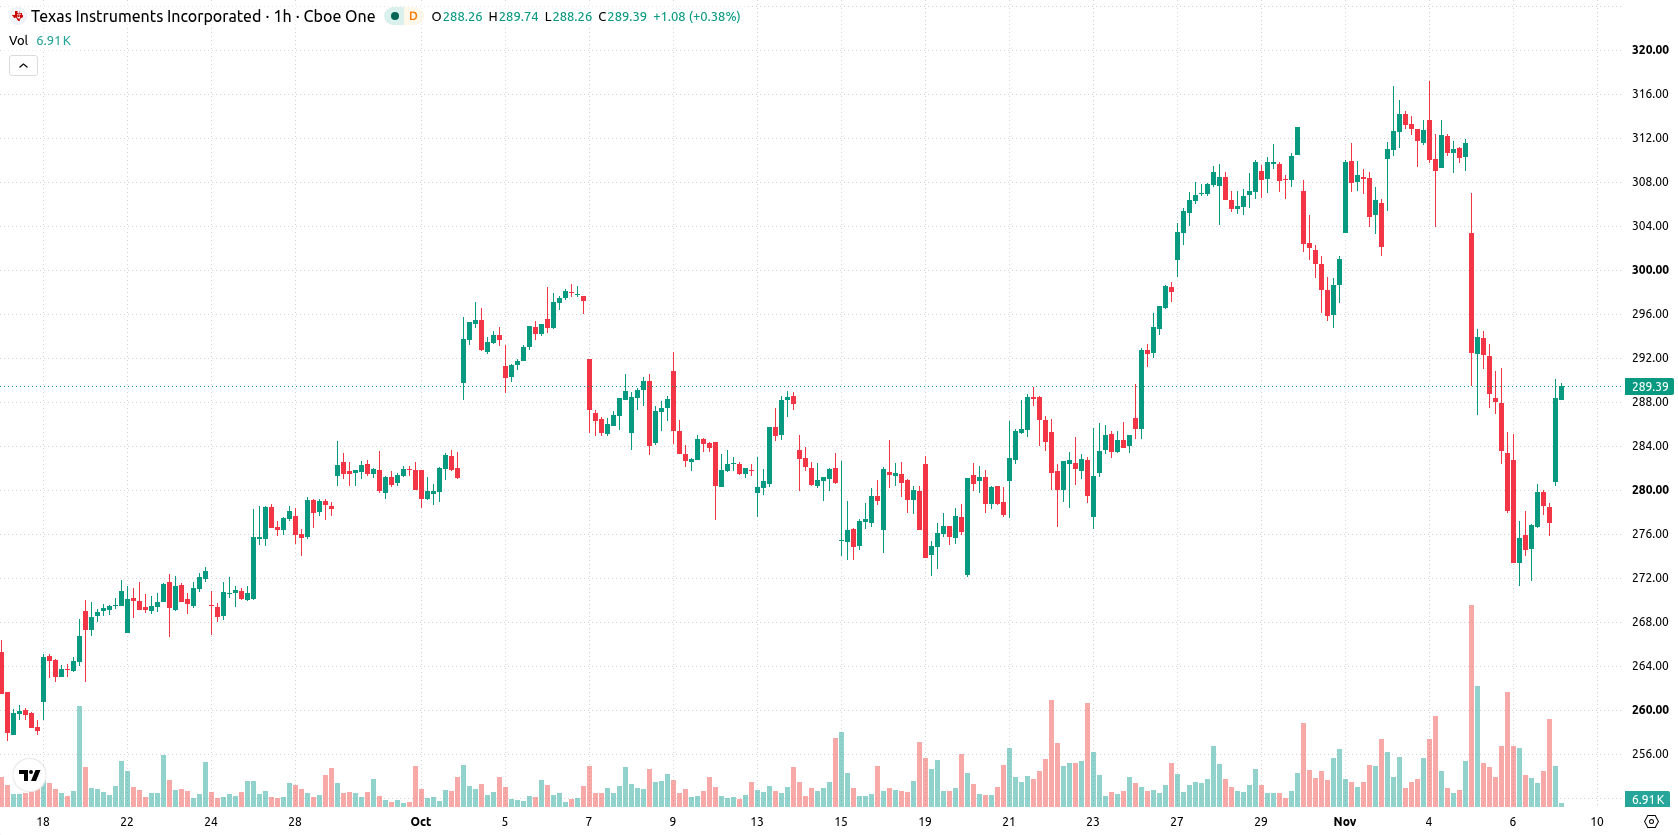
Texas Instruments (TXN) stock is trading at $287.6, posting a daily gain of 3.84%. The price currently sits below its key short- and medium-term moving averages, while holding above longer-term trend support.
 297.80
316.78
Highlights
- Texas Instruments will pay a quarterly dividend of CA$1.52 on November 10, 2026, providing continued returns to shareholders.
- The scheduled dividend may draw interest from income-focused investors, enhancing the stock's appeal in the current environment.
- Shares trade below short- and medium-term moving averages with weak momentum signals, implying 62% probability of a move to the $267.26 to $307.94 range's lower end.
Dividend clarity boosts shareholder appeal amid income-driven demand
Texas Instruments is scheduled to pay a quarterly dividend of CA$1.52 on November 10, 2026, according to Wealthawesome. This upcoming dividend reflects the company's continued approach to rewarding shareholders and may encourage demand from income-focused investors. The clarity around future capital returns adds to the stock's appeal in the current environment.
Bearish momentum prevails as short-term levels underperform
On the technical front, TXN is trading below the MA-20 and MA-50 but remains above the MA-200, highlighting medium-term pressure with longer-term support still intact. The immediate resistance level is identified at the daily Ichimoku Kijun, set at $294.22, while short-term momentum indicators such as MACD and ADX are both weak, confirming a bearish setting. RSI, Stochastic RSI, and CCI all register within neutral zones, suggesting a lack of clear directional conviction. Bull/Bear Power is negative at –4.32, indicating sellers are in control of intraday momentum, while the Awesome Oscillator is neutral.
Downside risk dominates as trading range narrows near resistance
In the short term, TXN is expected to range between $267.26 and $307.94, reflecting typical volatility for the stock. There is a 38% probability of an upward price move and a 62% chance of a decline, implying modestly higher risk to the downside. The base scenario anticipates price consolidation within the corridor. A bullish scenario would require a breakout above immediate resistance at $294.22, targeting higher levels within the band, while a bearish break of support could clear the way for a test of the lower range near $267.26.
Previously it was reported that Texas Instruments faced persistent downside pressure in the short and medium term, even as its long-term outlook remained supported by industrial expansion efforts. The current analysis adds that with technical momentum still subdued and sellers in control intraday, traders should monitor $294.22 as a pivotal level for any potential shift in direction.










-
 Afghanistan
-
 Albania
-
 Algeria
-
 Angola
-
 Argentina
-
 Armenia
-
 Australia
-
 Austria
-
 Azerbaijan
-
 Bahamas
-
 Bahrain
-
 Bangladesh
-
 Belarus
-
 Belgium
-
 Bolivia
-
 Botswana
-
 Brazil
-
 Brunei
-
 Bulgaria
-
 Cambodia
-
 Cameroon
-
 Canada
-
 Chile
-
 China
-
 Colombia
-
 Congo
-
 Costa Rica
-
 Cote d'Ivoire
-
 Croatia
-
 Cuba
-
 Cyprus
-
 Czechia
-
 DR Congo
-
 Denmark
-
 Dominican Republic
-
 Ecuador
-
 Egypt
-
 El Salvador
-
 Estonia
-
 Eswatini
-
 Ethiopia
-
 Finland
-
 France
-
 Georgia
-
 Germany
-
 Ghana
-
 Greece
-
 Haiti
-
 Hong Kong
-
 Hungary
-
 India
-
 Indonesia
-
 Iran, Islamic republic
-
 Iraq
-
 Ireland
-
 Israel
-
 Italy
-
 Jamaica
-
 Japan
-
 Jordan
-
 Kazakhstan
-
 Kenya
-
 Korea
-
 Kuwait
-
 Kyrgyzstan
-
 Laos
-
 Latvia
-
 Lebanon
-
 Lesotho
-
 Libya
-
 Lithuania
-
 Luxembourg
-
 Madagascar
-
 Malaysia
-
 Malta
-
 Mauritius
-
 Mexico
-
 Moldova
-
 Mongolia
-
 Montenegro
-
 Morocco
-
 Mozambique
-
 Myanmar
-
 Namibia
-
 Nepal
-
 Netherlands
-
 New Zealand
-
 Nigeria
-
 North Macedonia
-
 Norway
-
 Oman
-
 Pakistan
-
 Palestine
-
 Panama
-
 Papua New Guinea
-
 Paraguay
-
 Peru
-
 Philippines
-
 Poland
-
 Portugal
-
 Puerto Rico
-
 Qatar
-
 Reunion
-
 Romania
-
 Rwanda
-
 Saudi Arabia
-
 Serbia
-
 Singapore
-
 Slovakia
-
 Slovenia
-
 Somalia
-
 South Africa
-
 Spain
-
 Sri Lanka
-
 Sweden
-
 Switzerland
-
 Syria
-
 Taiwan
-
 Tajikistan
-
 Tanzania
-
 Thailand
-
 Trinidad and Tobago
-
 Tunisia
-
 Turkey
-
 UAE
-
 Uganda
-
 Ukraine
-
 United Kingdom
-
United States
-
 Uruguay
-
 Uzbekistan
-
 Venezuela
-
 Vietnam
-
 Yemen
-
 Zambia
-
 Zimbabwe
- Forex
- Crypto












