


Microsoft (MSFT) stock is trading at $544.19, up 2.56% on the day. The price is positioned above its key moving averages, indicating that short-, medium-, and long-term momentum is currently positive.
 538.19
559.07
Highlights
- ETFs withdrew $189.2 million from Microsoft stock on November 5, 2026, reflecting a short-term reduction in institutional demand.
- Microsoft stock advanced 2.56% to $544.19 and closed near the session high, with buy-side liquidity absorbing fund outflows.
- Technical momentum stays bullish with strong buyer dominance, but overbought conditions suggest a potential pullback within a $521.57 to $566.82 range.
Buy-side liquidity offsets ETF outflows as institutional demand drops
On November 5, 2026, ETFs recorded net outflows of $189.2 million from Microsoft, according to Yahoo Finance. This withdrawal signals a short-term reduction in institutional demand, as major ETF holders cut exposure and adjust portfolio allocations. However, despite this notable selling from large funds, the stock's ability to move higher today suggests that other market participants provided sufficient buy-side liquidity to absorb the outflows.
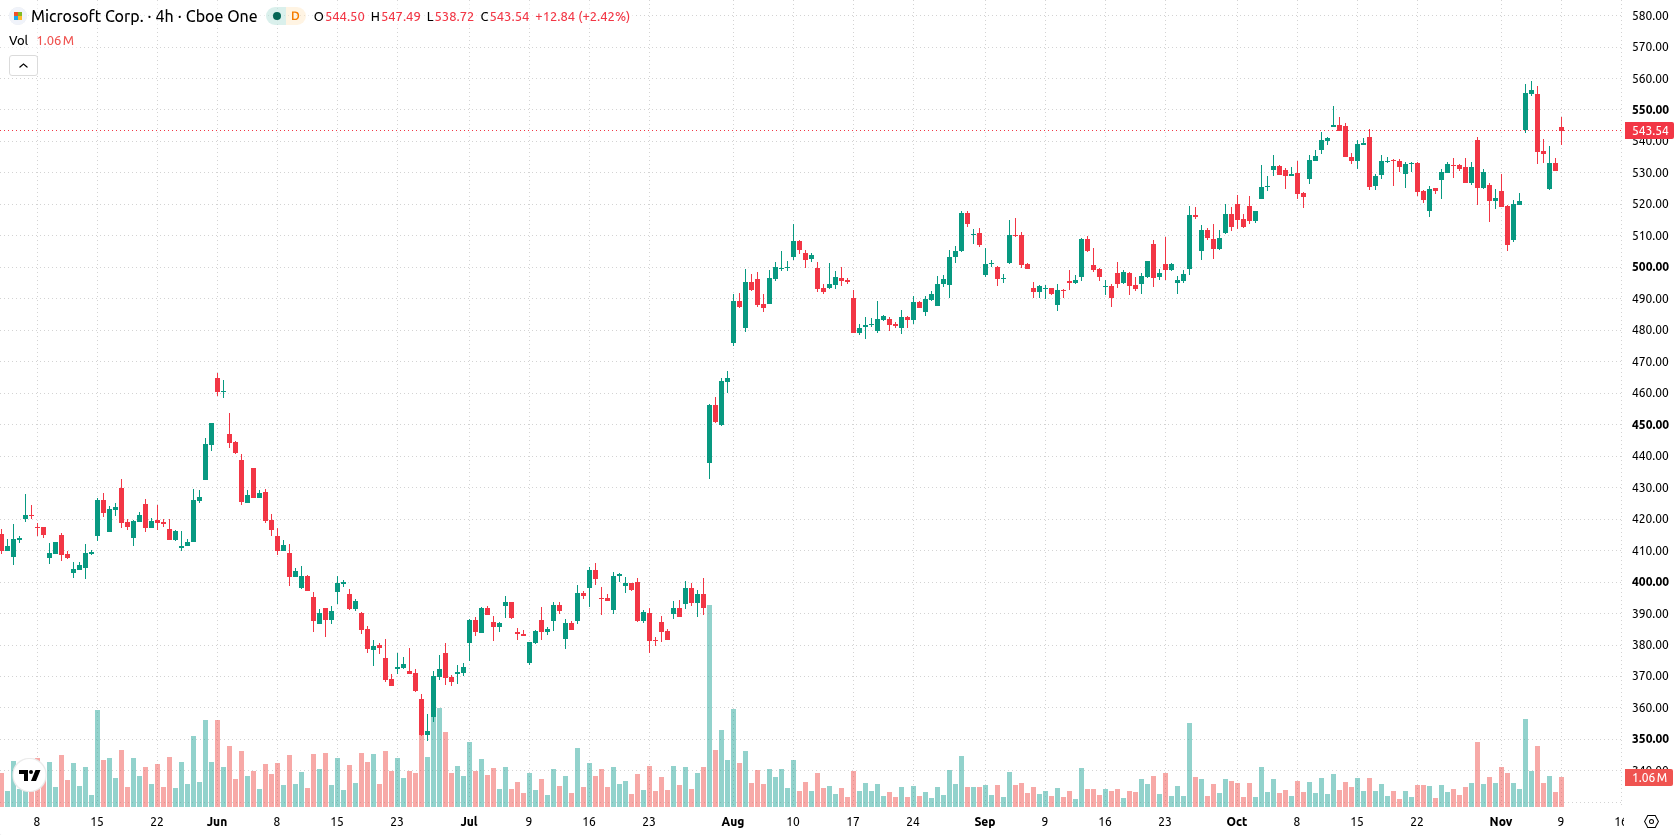
Overbought warning as bullish signals diverge on major indicators
Technically, MSFT is trading above the MA-20 and MA-50 on the four-hour chart, and remains well above the MA-200 on the daily timeframe. The Ichimoku Kijun sits at $532.05, marking immediate support. Momentum signals remain bullish with both MACD and ADX issuing Buy signals. RSI and Stoch RSI are neutral, while CCI is in the overbought zone, highlighting the risk of a near-term pullback. Bull/Bear Power is positive at 13.3, reflecting ongoing buyer dominance in intraday action, while the price finished close to the session high after recovering from an early gap down, with moderate volatility. The divergence between overbought CCI and neutral RSI/Stoch RSI warrants attention for possible short-term reversals.
High upside probability as range bound by strong support
Over the next two to three days, MSFT is expected to trade within the $521.57 to $566.82 range. The probability of an upward move is very high, while the risk of a decline is considered very low. Should price consolidate, a sideways range is likely, but a breakout above resistance could drive further gains toward the upper end of the volatility band. Conversely, a move below immediate support may trigger additional selling toward the range lows.
Earlier, analysts noted that Microsoft’s strong earnings growth and continued investment in cloud infrastructure supported a constructive outlook for the stock. The latest ETF outflows introduce a new dynamic, but with technical momentum still positive, traders should closely monitor the $532.05 support level as a gauge for sustaining the prevailing upside scenario.











-
 Afghanistan
-
 Albania
-
 Algeria
-
 Angola
-
 Argentina
-
 Armenia
-
 Australia
-
 Austria
-
 Azerbaijan
-
 Bahamas
-
 Bahrain
-
 Bangladesh
-
 Belarus
-
 Belgium
-
 Bolivia
-
 Botswana
-
 Brazil
-
 Brunei
-
 Bulgaria
-
 Cambodia
-
 Cameroon
-
 Canada
-
 Chile
-
 China
-
 Colombia
-
 Congo
-
 Costa Rica
-
 Cote d'Ivoire
-
 Croatia
-
 Cuba
-
 Cyprus
-
 Czechia
-
 DR Congo
-
 Denmark
-
 Dominican Republic
-
 Ecuador
-
 Egypt
-
 El Salvador
-
 Estonia
-
 Eswatini
-
 Ethiopia
-
 Finland
-
 France
-
 Georgia
-
 Germany
-
 Ghana
-
 Greece
-
 Haiti
-
 Hong Kong
-
 Hungary
-
 India
-
 Indonesia
-
 Iran, Islamic republic
-
 Iraq
-
 Ireland
-
 Israel
-
 Italy
-
 Jamaica
-
 Japan
-
 Jordan
-
 Kazakhstan
-
 Kenya
-
 Korea
-
 Kuwait
-
 Kyrgyzstan
-
 Laos
-
 Latvia
-
 Lebanon
-
 Lesotho
-
 Libya
-
 Lithuania
-
 Luxembourg
-
 Madagascar
-
 Malaysia
-
 Malta
-
 Mauritius
-
 Mexico
-
 Moldova
-
 Mongolia
-
 Montenegro
-
 Morocco
-
 Mozambique
-
 Myanmar
-
 Namibia
-
 Nepal
-
 Netherlands
-
 New Zealand
-
 Nigeria
-
 North Macedonia
-
 Norway
-
 Oman
-
 Pakistan
-
 Palestine
-
 Panama
-
 Papua New Guinea
-
 Paraguay
-
 Peru
-
 Philippines
-
 Poland
-
 Portugal
-
 Puerto Rico
-
 Qatar
-
 Reunion
-
 Romania
-
 Rwanda
-
 Saudi Arabia
-
 Serbia
-
 Singapore
-
 Slovakia
-
 Slovenia
-
 Somalia
-
 South Africa
-
 Spain
-
 Sri Lanka
-
 Sweden
-
 Switzerland
-
 Syria
-
 Taiwan
-
 Tajikistan
-
 Tanzania
-
 Thailand
-
 Trinidad and Tobago
-
 Tunisia
-
 Turkey
-
 UAE
-
 Uganda
-
 Ukraine
-
 United Kingdom
-
United States
-
 Uruguay
-
 Uzbekistan
-
 Venezuela
-
 Vietnam
-
 Yemen
-
 Zambia
-
 Zimbabwe
- Forex
- Crypto












