

Texas Instruments shares surge nearly 7% as bullish momentum and gap up drive strong price action

Texas Instruments Inc. (TXN) surged 6.95% today as strong bullish momentum and a decisive upside gap drove the price sharply higher. The move is supported by the stock trading well above its 20-day, 50-day, and 200-day moving averages, signaling continued technical strength.
 297.80
316.78
Highlights
- Texas Instruments stock trades above key moving averages, signaling positive momentum across short, medium, and long-term trends.
- Technical indicator signals are mixed, with MACD bullish, ADX and oscillators mostly neutral, and intraday sellers dominating market action.
- For the next 5 days, the stock is forecast between $273.46 and $318.94, with 62% probability of a downward move and crucial levels at $294.01 and $316.78.
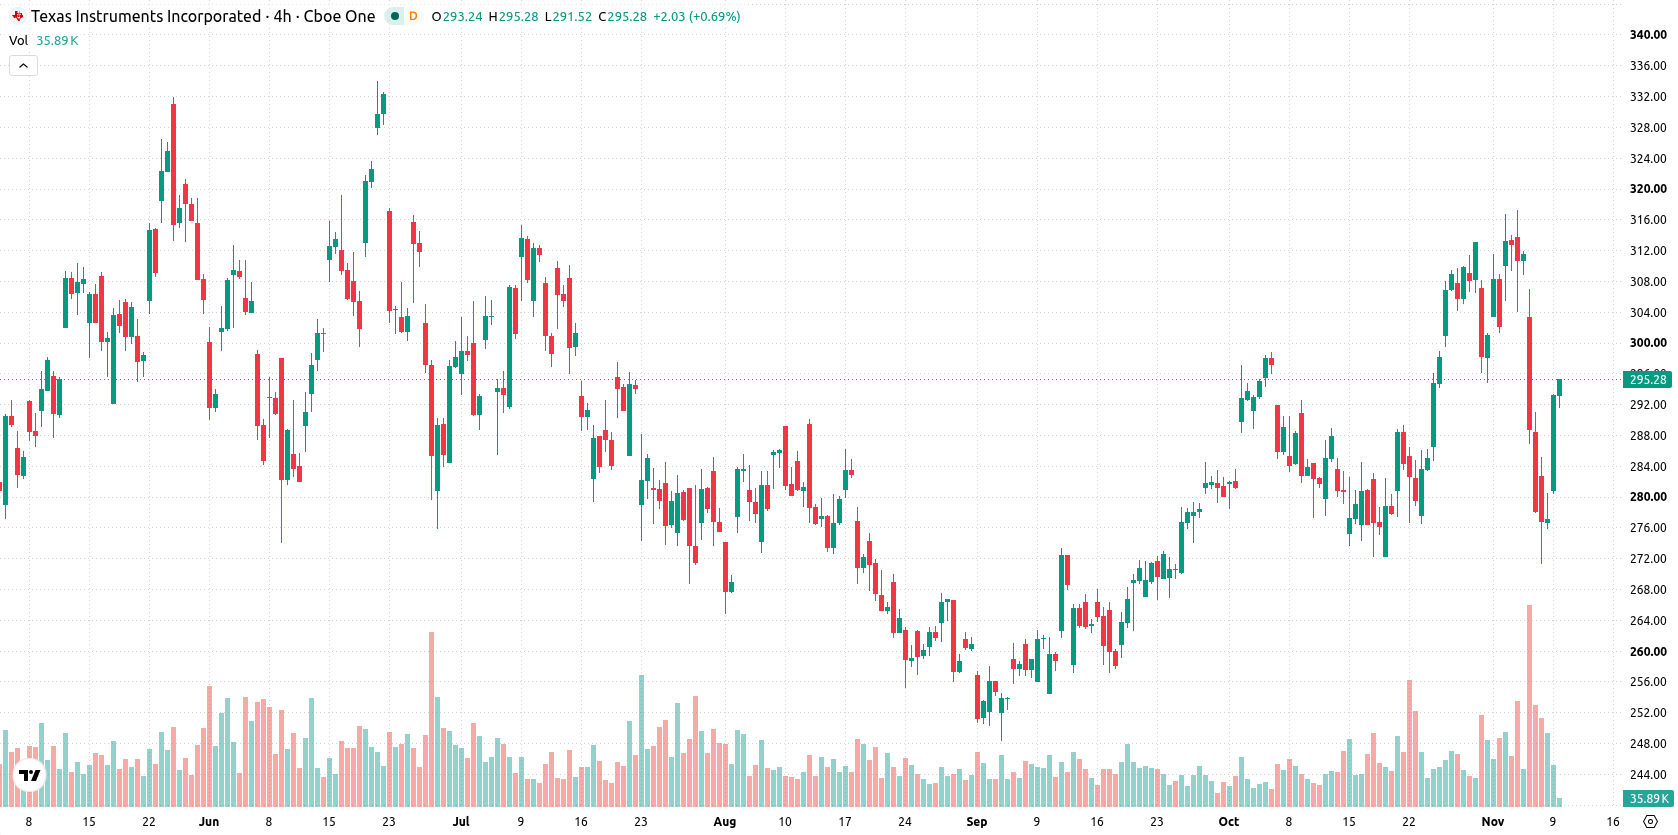
Mixed momentum as support holds above key averages
Texas Instruments is trading above its 20-day, 50-day, and 200-day moving averages ($291.07, $279.05, and $262.27), reflecting bullish short-, medium-, and long-term momentum. Immediate support is found at $294.01 (Ichimoku Kijun) and resistance at $316.78, the recent weekly high. Momentum indicators are mixed: MACD shows strong bullish momentum, ADX remains neutral, and both RSI and CCI stand neutral. The Stochastic RSI is oversold, suggesting a possible rebound for that oscillator alone. Bull/Bear Power (BBP) is negative, indicating sellers continue to dominate intraday momentum, and the Awesome Oscillator (AO) is neutral. The stock saw a strong upside gap of 0.22% at the open and gained $19.24, or 6.95%, on the day, closing near session highs as intraday volatility reached 3.39%. Despite mixed signals from some oscillators, price action demonstrated notable strength.
Earlier, analysts noted that Texas Instruments was facing sustained downside pressure in the short and medium term, even as longer-term support remained in place. The current bullish price action and breakout above major moving averages signal a shift in technical sentiment, with $316.78 emerging as the next key resistance level to monitor for further upside momentum.






Latest Texas Instruments News




-
 Afghanistan
-
 Albania
-
 Algeria
-
 Angola
-
 Argentina
-
 Armenia
-
 Australia
-
 Austria
-
 Azerbaijan
-
 Bahamas
-
 Bahrain
-
 Bangladesh
-
 Belarus
-
 Belgium
-
 Bolivia
-
 Botswana
-
 Brazil
-
 Brunei
-
 Bulgaria
-
 Cambodia
-
 Cameroon
-
 Canada
-
 Chile
-
 China
-
 Colombia
-
 Congo
-
 Costa Rica
-
 Cote d'Ivoire
-
 Croatia
-
 Cuba
-
 Cyprus
-
 Czechia
-
 DR Congo
-
 Denmark
-
 Dominican Republic
-
 Ecuador
-
 Egypt
-
 El Salvador
-
 Estonia
-
 Eswatini
-
 Ethiopia
-
 Finland
-
 France
-
 Georgia
-
 Germany
-
 Ghana
-
 Greece
-
 Haiti
-
 Hong Kong
-
 Hungary
-
 India
-
 Indonesia
-
 Iran, Islamic republic
-
 Iraq
-
 Ireland
-
 Israel
-
 Italy
-
 Jamaica
-
 Japan
-
 Jordan
-
 Kazakhstan
-
 Kenya
-
 Korea
-
 Kuwait
-
 Kyrgyzstan
-
 Laos
-
 Latvia
-
 Lebanon
-
 Lesotho
-
 Libya
-
 Lithuania
-
 Luxembourg
-
 Madagascar
-
 Malaysia
-
 Malta
-
 Mauritius
-
 Mexico
-
 Moldova
-
 Mongolia
-
 Montenegro
-
 Morocco
-
 Mozambique
-
 Myanmar
-
 Namibia
-
 Nepal
-
 Netherlands
-
 New Zealand
-
 Nigeria
-
 North Macedonia
-
 Norway
-
 Oman
-
 Pakistan
-
 Palestine
-
 Panama
-
 Papua New Guinea
-
 Paraguay
-
 Peru
-
 Philippines
-
 Poland
-
 Portugal
-
 Puerto Rico
-
 Qatar
-
 Reunion
-
 Romania
-
 Rwanda
-
 Saudi Arabia
-
 Serbia
-
 Singapore
-
 Slovakia
-
 Slovenia
-
 Somalia
-
 South Africa
-
 Spain
-
 Sri Lanka
-
 Sweden
-
 Switzerland
-
 Syria
-
 Taiwan
-
 Tajikistan
-
 Tanzania
-
 Thailand
-
 Trinidad and Tobago
-
 Tunisia
-
 Turkey
-
 UAE
-
 Uganda
-
 Ukraine
-
 United Kingdom
-
United States
-
 Uruguay
-
 Uzbekistan
-
 Venezuela
-
 Vietnam
-
 Yemen
-
 Zambia
-
 Zimbabwe
- Forex
- Crypto












