

What's behind Advanced Energy's latest 12.2% stock surge?

Advanced Energy Industries, Inc. (AEIS) jumped 12.21% after reporting record quarterly results driven by a historic surge in semiconductor revenue and robust net income growth. The rebound looks limited, with the stock still trading below its 20-day, 50-day, and 200-day moving averages and near-term resistance overhead.
 221.60
244.52
Highlights
- Advanced Energy reported record quarterly semiconductor revenue of $322 million, up 64% year-over-year in its core segments.
- Net income reached $115.6 million and a quarterly dividend of $0.10 per share is set for December 4, 2026.
- Shares of Advanced Energy recently surged 12.21% with short-term strength, but technical signals indicate a broadly bearish trend and a projected range of $188.25 to $254.01 for the next 5 trading days.
Profit gains and new orders shift sentiment as semiconductor revenue spikes
Advanced Energy reported a record quarter with semiconductor revenue reaching $322 million, marking a 64% increase year-over-year in its core segments. Net income climbed to $115.6 million. The company also approved a quarterly dividend of $0.10 per share, set for payment on December 4, 2026, and secured new plasma-power design wins for advanced-node semiconductor processes.
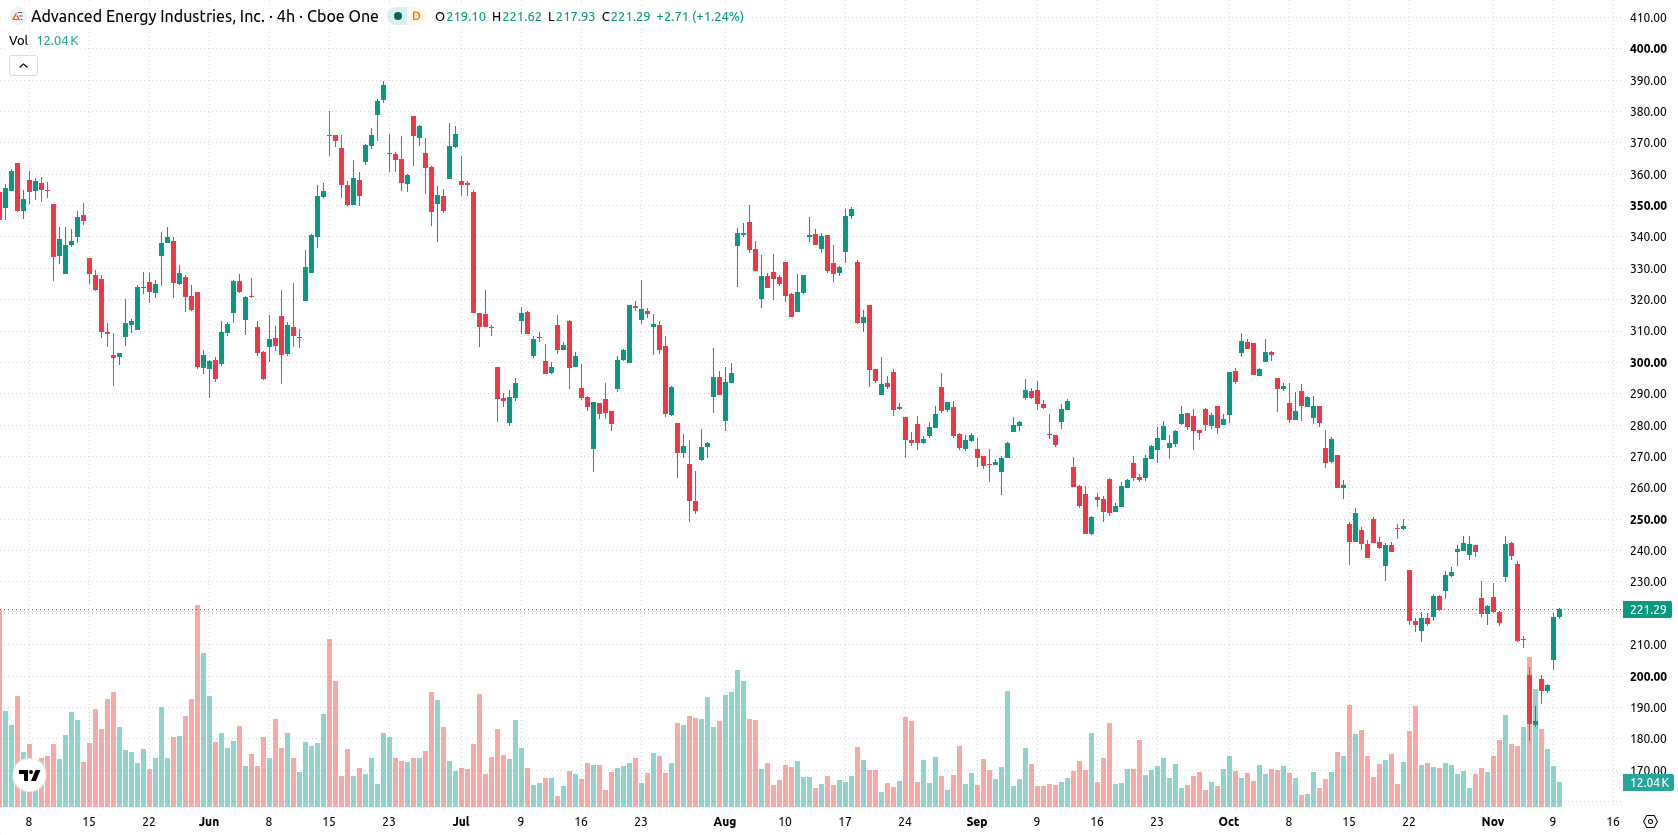
Bearish momentum persists as price lags below key technical thresholds
AEIS is trading below its 20-day, 50-day, and 200-day moving averages (MA-20 $233.72, MA-50 $260.08, MA-200 $307.47), reflecting persistent downward pressure across all timeframes. The near-term resistance ceiling stands at $221.6, with support at $209.85. The Ichimoku Kijun ($243.78) and distant moving averages confirm an overall bearish trend structure. Momentum indicators show a mixed outlook: the MACD and ADX are both signaling sell, underscoring continued bearish momentum. The RSI and Stochastic RSI are neutral, and the CCI is in the oversold zone, which may suggest upside rebound potential. BBP is negative, reflecting intraday dominance by sellers. The Awesome Oscillator also confirms prevailing bearish momentum. Intraday volatility measures 5.60%. Despite a 12.21% price surge after an upside gap of roughly 6.85%, technical signals indicate the session’s strong upside follow-through stands in contrast to the ongoing negative momentum outlook.
Earlier, analysts noted that despite Advanced Energy's strong quarterly performance, the stock was exhibiting persistent technical weakness and a prevailing bearish trend. The current analysis adds that, while the recent price rebound signals some upside potential, ongoing bearish momentum and elevated volatility mean traders should closely monitor the $221.6 resistance and $209.85 support levels for direction in the days ahead.






Latest Advanced Energy News




-
 Afghanistan
-
 Albania
-
 Algeria
-
 Angola
-
 Argentina
-
 Armenia
-
 Australia
-
 Austria
-
 Azerbaijan
-
 Bahamas
-
 Bahrain
-
 Bangladesh
-
 Belarus
-
 Belgium
-
 Bolivia
-
 Botswana
-
 Brazil
-
 Brunei
-
 Bulgaria
-
 Cambodia
-
 Cameroon
-
 Canada
-
 Chile
-
 China
-
 Colombia
-
 Congo
-
 Costa Rica
-
 Cote d'Ivoire
-
 Croatia
-
 Cuba
-
 Cyprus
-
 Czechia
-
 DR Congo
-
 Denmark
-
 Dominican Republic
-
 Ecuador
-
 Egypt
-
 El Salvador
-
 Estonia
-
 Eswatini
-
 Ethiopia
-
 Finland
-
 France
-
 Georgia
-
 Germany
-
 Ghana
-
 Greece
-
 Haiti
-
 Hong Kong
-
 Hungary
-
 India
-
 Indonesia
-
 Iran, Islamic republic
-
 Iraq
-
 Ireland
-
 Israel
-
 Italy
-
 Jamaica
-
 Japan
-
 Jordan
-
 Kazakhstan
-
 Kenya
-
 Korea
-
 Kuwait
-
 Kyrgyzstan
-
 Laos
-
 Latvia
-
 Lebanon
-
 Lesotho
-
 Libya
-
 Lithuania
-
 Luxembourg
-
 Madagascar
-
 Malaysia
-
 Malta
-
 Mauritius
-
 Mexico
-
 Moldova
-
 Mongolia
-
 Montenegro
-
 Morocco
-
 Mozambique
-
 Myanmar
-
 Namibia
-
 Nepal
-
 Netherlands
-
 New Zealand
-
 Nigeria
-
 North Macedonia
-
 Norway
-
 Oman
-
 Pakistan
-
 Palestine
-
 Panama
-
 Papua New Guinea
-
 Paraguay
-
 Peru
-
 Philippines
-
 Poland
-
 Portugal
-
 Puerto Rico
-
 Qatar
-
 Reunion
-
 Romania
-
 Rwanda
-
 Saudi Arabia
-
 Serbia
-
 Singapore
-
 Slovakia
-
 Slovenia
-
 Somalia
-
 South Africa
-
 Spain
-
 Sri Lanka
-
 Sweden
-
 Switzerland
-
 Syria
-
 Taiwan
-
 Tajikistan
-
 Tanzania
-
 Thailand
-
 Trinidad and Tobago
-
 Tunisia
-
 Turkey
-
 UAE
-
 Uganda
-
 Ukraine
-
 United Kingdom
-
United States
-
 Uruguay
-
 Uzbekistan
-
 Venezuela
-
 Vietnam
-
 Yemen
-
 Zambia
-
 Zimbabwe
- Forex
- Crypto












