

Nebius Group shares jump about 9.5% after analysts forecast over 500% year-over-year revenue growth

Nebius Group N.V. (NBIS) climbed 9.48% after anticipation built around its upcoming third-quarter 2026 earnings report, which is expected to show over 500% revenue growth year-over-year. The rebound looks limited, with the stock still trading below its 20-day, 50-day, and 200-day moving averages.
 143.39
152.57
Highlights
- Nebius Group will report third-quarter 2026 results on November 12 with analysts expecting revenue between $905 million and $908 million and an adjusted loss per share of $0.61 to $1.11.
- Recent capital raises for AI cloud expansion raised the share count to 238 million, and sector scrutiny has caused significant price volatility with options volatility at 188%.
- Shares of Nebius Group trade below key moving averages with persistent bearish momentum, and over the next five days the expected range is $122.71 to $161.31 with a 75% chance of a downward move.
Price swings intensify amid sector scrutiny and rising share count
Nebius Group will release its third-quarter 2026 financial results before the market opens on November 12, with analyst expectations for quarterly revenue between $905 million and $908 million and a projected adjusted loss per share in the range of $0.61 to $1.11. The company has faced significant price volatility ahead of earnings due to increased sector scrutiny and ongoing evaluations from major customers including Microsoft and Meta. Recent capital raises to expand AI cloud infrastructure have increased the share count to 238 million, and implied options volatility stands at 188%.
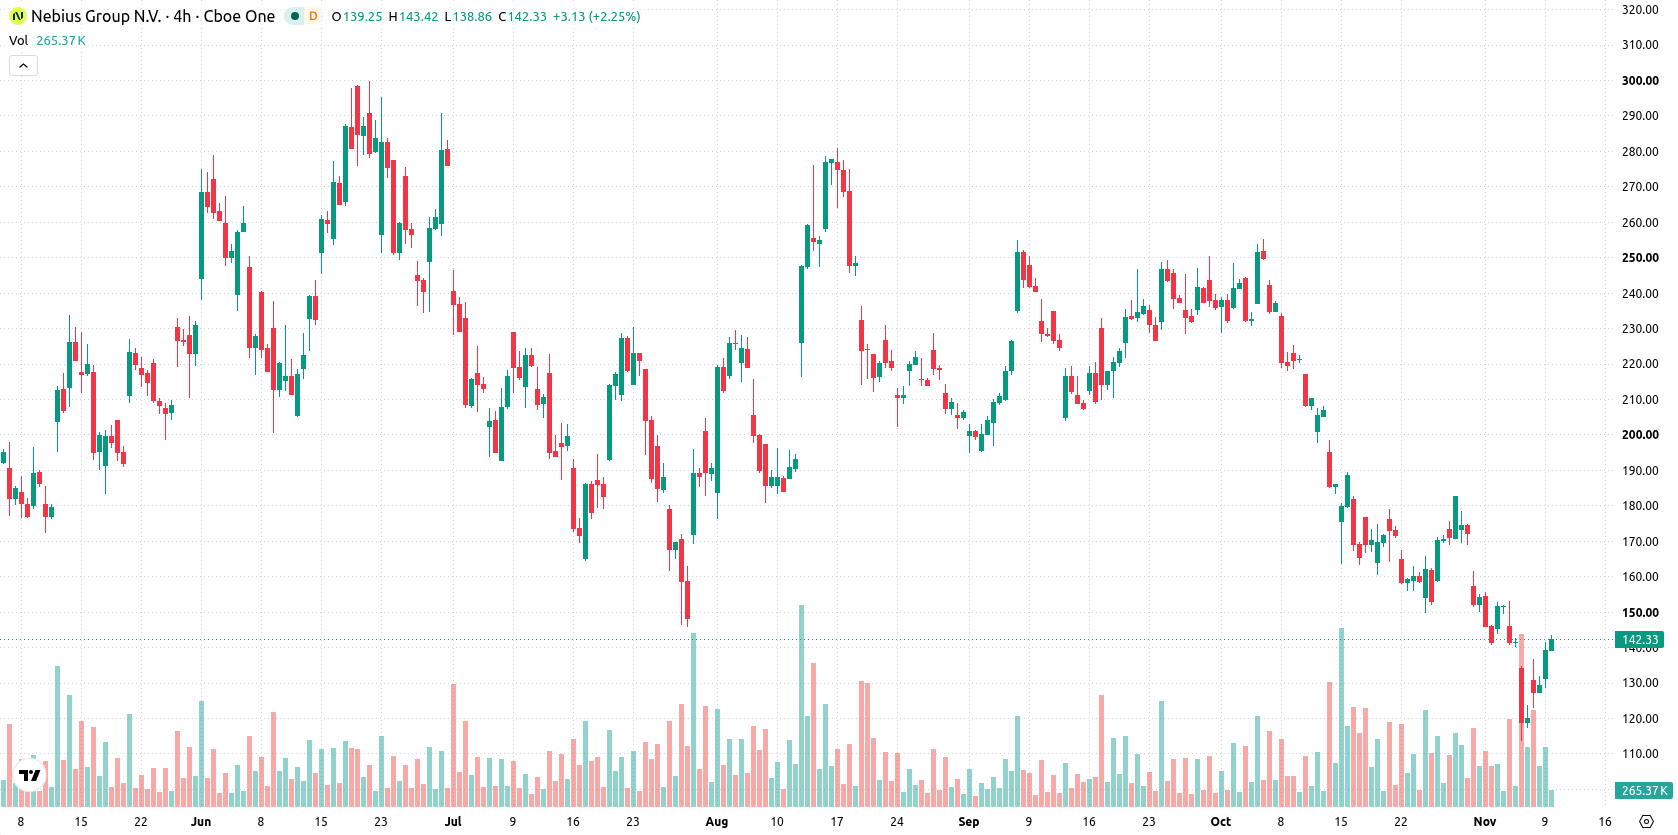
Bearish momentum persists as stock tests key support and resistance
NBIS remains below its 20-day, 50-day, and 200-day moving averages ($165.23, $201.71, and $178.38), indicating continued selling pressure across all timeframes. Resistance is situated at $152.57, while support is at the recent high of $141.55. More distant levels, such as the Ichimoku Kijun at $184.39, highlight a bearish technical structure. Momentum signals, including the MACD and ADX, remain bearish. Both the RSI and Stochastic RSI are neutral, with the CCI in the oversold zone. Intraday momentum is negative as shown by the Bull/Bear Power, and the Awesome Oscillator aligns with bearish sentiment. Despite the stock trading near its session highs with notable firm tone and 10.15% intraday volatility, technical momentum highlights a mix of bearish and oversold conditions.
Earlier, analysts noted that Nebius Group remained under sustained selling pressure amid sector risks and technical weakness. The latest update adds a new dimension, as increased options volatility and expanded share count heighten both upside potential above $152.57 and downside risk if support at $141.55 fails.






Latest Nebius Group N.V. News




-
 Afghanistan
-
 Albania
-
 Algeria
-
 Angola
-
 Argentina
-
 Armenia
-
 Australia
-
 Austria
-
 Azerbaijan
-
 Bahamas
-
 Bahrain
-
 Bangladesh
-
 Belarus
-
 Belgium
-
 Bolivia
-
 Botswana
-
 Brazil
-
 Brunei
-
 Bulgaria
-
 Cambodia
-
 Cameroon
-
 Canada
-
 Chile
-
 China
-
 Colombia
-
 Congo
-
 Costa Rica
-
 Cote d'Ivoire
-
 Croatia
-
 Cuba
-
 Cyprus
-
 Czechia
-
 DR Congo
-
 Denmark
-
 Dominican Republic
-
 Ecuador
-
 Egypt
-
 El Salvador
-
 Estonia
-
 Eswatini
-
 Ethiopia
-
 Finland
-
 France
-
 Georgia
-
 Germany
-
 Ghana
-
 Greece
-
 Haiti
-
 Hong Kong
-
 Hungary
-
 India
-
 Indonesia
-
 Iran, Islamic republic
-
 Iraq
-
 Ireland
-
 Israel
-
 Italy
-
 Jamaica
-
 Japan
-
 Jordan
-
 Kazakhstan
-
 Kenya
-
 Korea
-
 Kuwait
-
 Kyrgyzstan
-
 Laos
-
 Latvia
-
 Lebanon
-
 Lesotho
-
 Libya
-
 Lithuania
-
 Luxembourg
-
 Madagascar
-
 Malaysia
-
 Malta
-
 Mauritius
-
 Mexico
-
 Moldova
-
 Mongolia
-
 Montenegro
-
 Morocco
-
 Mozambique
-
 Myanmar
-
 Namibia
-
 Nepal
-
 Netherlands
-
 New Zealand
-
 Nigeria
-
 North Macedonia
-
 Norway
-
 Oman
-
 Pakistan
-
 Palestine
-
 Panama
-
 Papua New Guinea
-
 Paraguay
-
 Peru
-
 Philippines
-
 Poland
-
 Portugal
-
 Puerto Rico
-
 Qatar
-
 Reunion
-
 Romania
-
 Rwanda
-
 Saudi Arabia
-
 Serbia
-
 Singapore
-
 Slovakia
-
 Slovenia
-
 Somalia
-
 South Africa
-
 Spain
-
 Sri Lanka
-
 Sweden
-
 Switzerland
-
 Syria
-
 Taiwan
-
 Tajikistan
-
 Tanzania
-
 Thailand
-
 Trinidad and Tobago
-
 Tunisia
-
 Turkey
-
 UAE
-
 Uganda
-
 Ukraine
-
 United Kingdom
-
United States
-
 Uruguay
-
 Uzbekistan
-
 Venezuela
-
 Vietnam
-
 Yemen
-
 Zambia
-
 Zimbabwe
- Forex
- Crypto












