

Nebius Group shares slumps nearly 10% as traders react to narrowed 2026 outlook and selling momentum

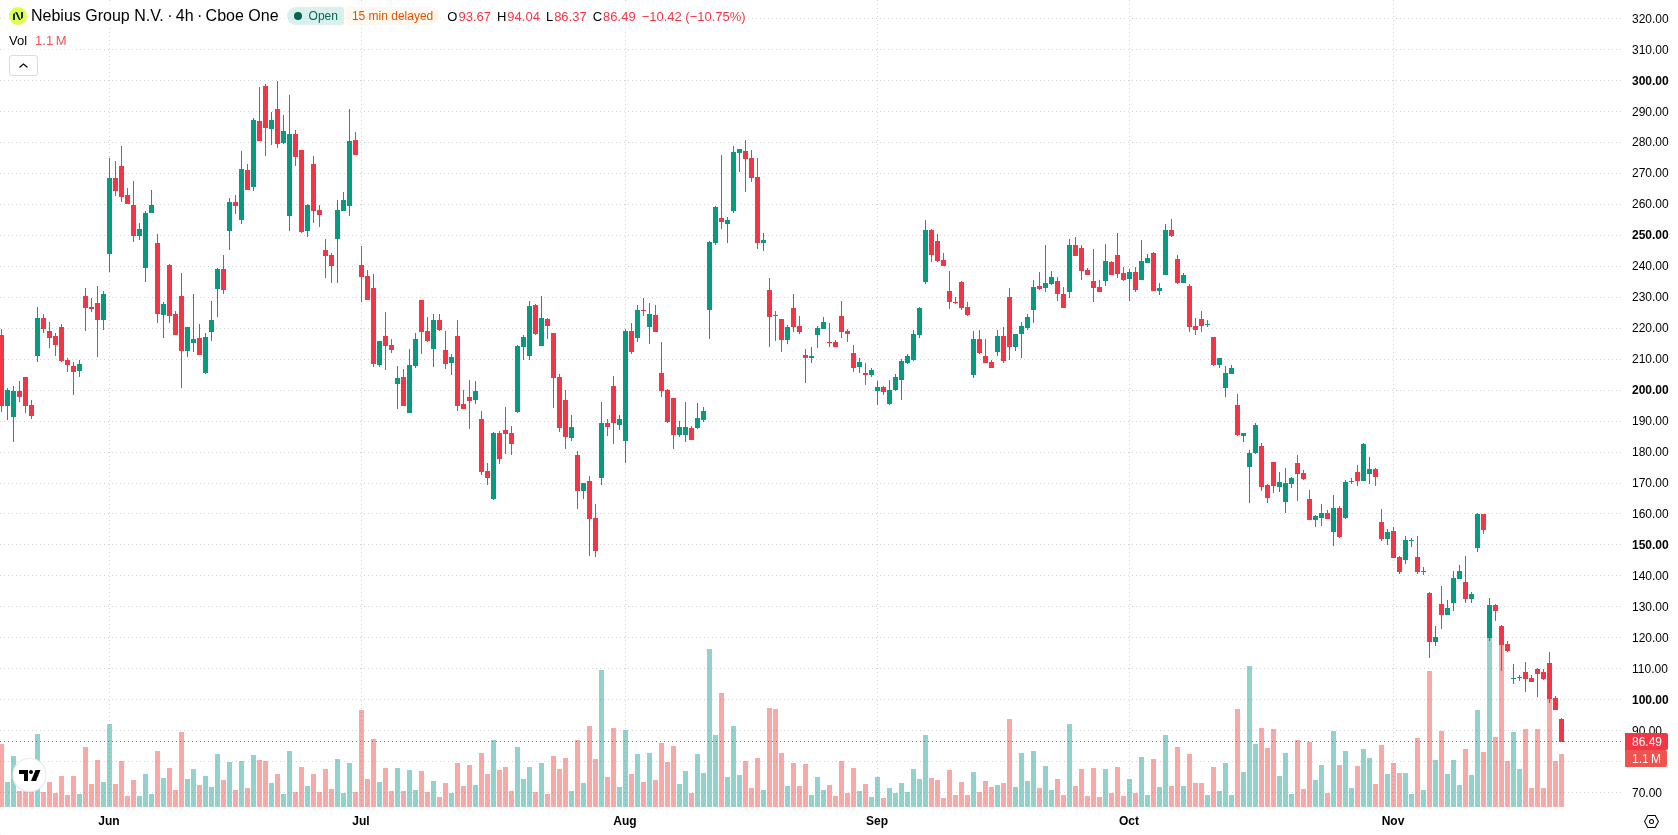
Nebius Group N.V. (NBIS) slumped 9.95% after reporting robust third-quarter revenue growth paired with a narrowed 2026 outlook, as delays in third-party data centers and market volatility led traders to aggressively unwind earlier gains. The move is reinforced by heavy downside momentum and persistent selling pressure, with the price remaining well below all major moving averages.
 94.04
115.18
Highlights
- Nebius Group reported third-quarter 2026 revenue of $980.8 million, up 571% year over year, with a net loss of $37.5 million.
- The company adjusted its 2026 revenue guidance to $3 billion to $3.2 billion due to third-party data center delays and forecasts $12 to $13 billion for 2027, with planned capital expenditures of $27 billion in 2026 and $40 to $45 billion in 2027.
- Shares of Nebius are trading well below key moving averages, with strong bearish momentum and a forecasted five-day range of $77.96 to $96.75.
Revenue surge outpaced by lower guidance and ongoing supply delays
Nebius Group reported third-quarter 2026 revenue of $980.8 million, representing a 571% year-over-year increase, and posted a net loss of $37.5 million. The company lowered the top end of its 2026 revenue outlook to between $3 billion and $3.2 billion due to delays at third-party data centers. Nebius also issued a 2027 revenue forecast of $12–13 billion, plans capital expenditures of $27 billion in 2026 and $40–45 billion in 2027, and noted continued strong customer prepayments. Trading in Nebius shares resumed on Nasdaq under the NBIS ticker in October 2024 following its separation from the Russian business, though price action has remained under broader selling pressure.
Persistent bearish signals as price fails to reclaim technical levels
Nebius is trading well below its short-, medium-, and long-term moving averages, with the price at $87.28 versus the MA-20 at $138.47, MA-50 at $184.23, and MA-200 at $179.73. This setup indicates persistent downward pressure across all time frames, confirming a short-term bearish bias even though the MA-50 remains above the MA-200 in the longer term. Immediate resistance is at $96.54, with the nearest support at $77.96. Technical indicators show that both the MACD and ADX have issued sell signals, reflecting ongoing bearish momentum. The RSI is neutral, while the Stochastic RSI and CCI are both in their oversold zones, suggesting possible selling exhaustion. Bull/Bear Power remains negative, pointing to continued seller dominance in intraday trading. The Awesome Oscillator does not provide further trend confirmation.
Previously it was reported that Nebius Group faced persistent technical and fundamental pressures following its strong revenue growth but tempered outlook and increased capital expenditures. The current analysis reinforces this bearish view, with volatility expected to remain elevated and the $77.96 support level emerging as a critical threshold for potential further downside.






Latest Nebius Group N.V. News





-
 Afghanistan
-
 Albania
-
 Algeria
-
 Angola
-
 Argentina
-
 Armenia
-
 Australia
-
 Austria
-
 Azerbaijan
-
 Bahamas
-
 Bahrain
-
 Bangladesh
-
 Belarus
-
 Belgium
-
 Bolivia
-
 Botswana
-
 Brazil
-
 Brunei
-
 Bulgaria
-
 Cambodia
-
 Cameroon
-
 Canada
-
 Chile
-
 China
-
 Colombia
-
 Congo
-
 Costa Rica
-
 Cote d'Ivoire
-
 Croatia
-
 Cuba
-
 Cyprus
-
 Czechia
-
 DR Congo
-
 Denmark
-
 Dominican Republic
-
 Ecuador
-
 Egypt
-
 El Salvador
-
 Estonia
-
 Eswatini
-
 Ethiopia
-
 Finland
-
 France
-
 Georgia
-
 Germany
-
 Ghana
-
 Greece
-
 Haiti
-
 Hong Kong
-
 Hungary
-
 India
-
 Indonesia
-
 Iran, Islamic republic
-
 Iraq
-
 Ireland
-
 Israel
-
 Italy
-
 Jamaica
-
 Japan
-
 Jordan
-
 Kazakhstan
-
 Kenya
-
 Korea
-
 Kuwait
-
 Kyrgyzstan
-
 Laos
-
 Latvia
-
 Lebanon
-
 Lesotho
-
 Libya
-
 Lithuania
-
 Luxembourg
-
 Madagascar
-
 Malaysia
-
 Malta
-
 Mauritius
-
 Mexico
-
 Moldova
-
 Mongolia
-
 Montenegro
-
 Morocco
-
 Mozambique
-
 Myanmar
-
 Namibia
-
 Nepal
-
 Netherlands
-
 New Zealand
-
 Nigeria
-
 North Macedonia
-
 Norway
-
 Oman
-
 Pakistan
-
 Palestine
-
 Panama
-
 Papua New Guinea
-
 Paraguay
-
 Peru
-
 Philippines
-
 Poland
-
 Portugal
-
 Puerto Rico
-
 Qatar
-
 Reunion
-
 Romania
-
 Rwanda
-
 Saudi Arabia
-
 Serbia
-
 Singapore
-
 Slovakia
-
 Slovenia
-
 Somalia
-
 South Africa
-
 Spain
-
 Sri Lanka
-
 Sweden
-
 Switzerland
-
 Syria
-
 Taiwan
-
 Tajikistan
-
 Tanzania
-
 Thailand
-
 Trinidad and Tobago
-
 Tunisia
-
 Turkey
-
 UAE
-
 Uganda
-
 Ukraine
-
 United Kingdom
-
United States
-
 Uruguay
-
 Uzbekistan
-
 Venezuela
-
 Vietnam
-
 Yemen
-
 Zambia
-
 Zimbabwe
- Forex
- Crypto












