

Nebius Group stock tumbles nearly 17% as strong growth is overshadowed by cautious revenue outlook and higher capex

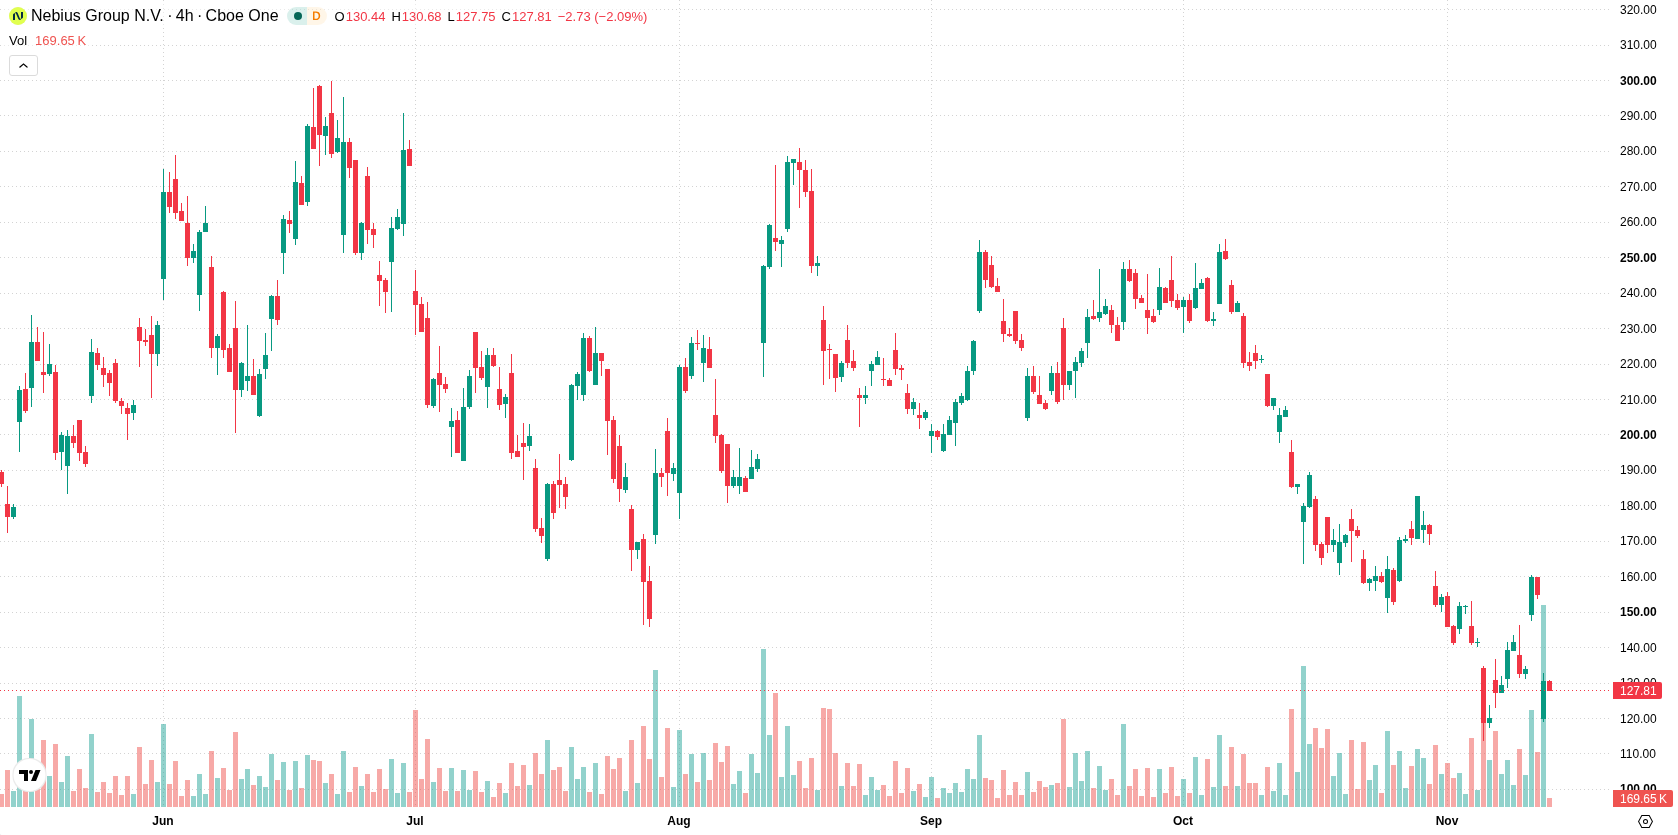
Nebius Group N.V. (NBIS) tumbled 16.77% after reporting strong quarterly growth but softening its revenue outlook and raising capex guidance. The down move is reinforced, with Nebius Group trading well below all major moving averages and heavy negative momentum signals dominating the technical picture.
 123.97
160.10
Highlights
- Nebius Group reported third quarter revenue of $980.8 million, up 571% year over year, with adjusted EBITDA of $465.8 million on strong AI cloud demand.
- The company narrowed its GAAP net loss to $37.5 million, raised $5.75 billion through convertible notes, and lifted 2026 capital spending guidance to $27 billion.
- Shares of Nebius Group are trading below key moving averages with bearish momentum signals, and the expected five-day range is $110.51 to $159.1.
Downside pressure persists as upbeat revenue and capital raise meet caution
Nebius Group posted significant financial results for the third quarter of 2026, with revenue increasing 571% year-over-year to $980.8 million and adjusted EBITDA reaching $465.8 million, reflecting expansion in AI cloud operations. The company reported a GAAP net loss of $37.5 million, a narrower loss than last year and ahead of analyst expectations. Nebius revised its full-year 2026 revenue forecast to the low end of its $3 billion to $3.4 billion range and issued initial 2027 revenue guidance of $12 to $13 billion, while increasing its 2026 capital expenditure guidance to $27 billion. $5.75 billion was raised through convertible notes, and cash reserves grew to $7.4 billion, though price action has remained under broader selling pressure.
Bearish momentum intensifies as technical signals diverge from intraday strength
Nebius Group is trading well below its short-, medium-, and long-term moving averages, with the current price at $128.96 compared to the 20-day, 50-day, and 200-day levels of $156.8, $198.09, and $179.13 respectively. This indicates ongoing pressure from sellers across all timeframes, with the nearest resistance at $131.61 and the most recent support at $123.19, while longer-term structure retains a bullish alignment according to the MA-50 vs MA-200. Momentum readings show the MACD and Average Directional Index (ADX) firmly in sell territory, underscoring persistent bearish pressure. The Relative Strength Index (RSI) and Commodity Channel Index (CCI) are both neutral, while the Stochastic RSI is in the overbought zone, suggesting a possible downside correction risk. Bull/Bear Power (BBP) points to buyers holding the upper hand in intraday momentum. The stock opened with a notable downside gap of $35.06 (22.63%) and has slipped $25.985 or 16.77%, though price action is near the session high as intraday volatility stands at 9.78%. There is a clear divergence between strong intraday buying and sustained negative momentum indicators.
Previously it was reported that Nebius Group posted strong quarterly revenue growth and secured significant debt financing amid heightened attention on AI infrastructure spending. The current technical and volatility setup underscores a critical inflection point, with traders advised to monitor the $123.19 support as a potential trigger for further downside risk.






Latest Nebius Group N.V. News



-
 Afghanistan
-
 Albania
-
 Algeria
-
 Angola
-
 Argentina
-
 Armenia
-
 Australia
-
 Austria
-
 Azerbaijan
-
 Bahamas
-
 Bahrain
-
 Bangladesh
-
 Belarus
-
 Belgium
-
 Bolivia
-
 Botswana
-
 Brazil
-
 Brunei
-
 Bulgaria
-
 Cambodia
-
 Cameroon
-
 Canada
-
 Chile
-
 China
-
 Colombia
-
 Congo
-
 Costa Rica
-
 Cote d'Ivoire
-
 Croatia
-
 Cuba
-
 Cyprus
-
 Czechia
-
 DR Congo
-
 Denmark
-
 Dominican Republic
-
 Ecuador
-
 Egypt
-
 El Salvador
-
 Estonia
-
 Eswatini
-
 Ethiopia
-
 Finland
-
 France
-
 Georgia
-
 Germany
-
 Ghana
-
 Greece
-
 Haiti
-
 Hong Kong
-
 Hungary
-
 India
-
 Indonesia
-
 Iran, Islamic republic
-
 Iraq
-
 Ireland
-
 Israel
-
 Italy
-
 Jamaica
-
 Japan
-
 Jordan
-
 Kazakhstan
-
 Kenya
-
 Korea
-
 Kuwait
-
 Kyrgyzstan
-
 Laos
-
 Latvia
-
 Lebanon
-
 Lesotho
-
 Libya
-
 Lithuania
-
 Luxembourg
-
 Madagascar
-
 Malaysia
-
 Malta
-
 Mauritius
-
 Mexico
-
 Moldova
-
 Mongolia
-
 Montenegro
-
 Morocco
-
 Mozambique
-
 Myanmar
-
 Namibia
-
 Nepal
-
 Netherlands
-
 New Zealand
-
 Nigeria
-
 North Macedonia
-
 Norway
-
 Oman
-
 Pakistan
-
 Palestine
-
 Panama
-
 Papua New Guinea
-
 Paraguay
-
 Peru
-
 Philippines
-
 Poland
-
 Portugal
-
 Puerto Rico
-
 Qatar
-
 Reunion
-
 Romania
-
 Rwanda
-
 Saudi Arabia
-
 Serbia
-
 Singapore
-
 Slovakia
-
 Slovenia
-
 Somalia
-
 South Africa
-
 Spain
-
 Sri Lanka
-
 Sweden
-
 Switzerland
-
 Syria
-
 Taiwan
-
 Tajikistan
-
 Tanzania
-
 Thailand
-
 Trinidad and Tobago
-
 Tunisia
-
 Turkey
-
 UAE
-
 Uganda
-
 Ukraine
-
 United Kingdom
-
United States
-
 Uruguay
-
 Uzbekistan
-
 Venezuela
-
 Vietnam
-
 Yemen
-
 Zambia
-
 Zimbabwe
- Forex
- Crypto












