

What's behind Nebius Group's latest stock pullback?

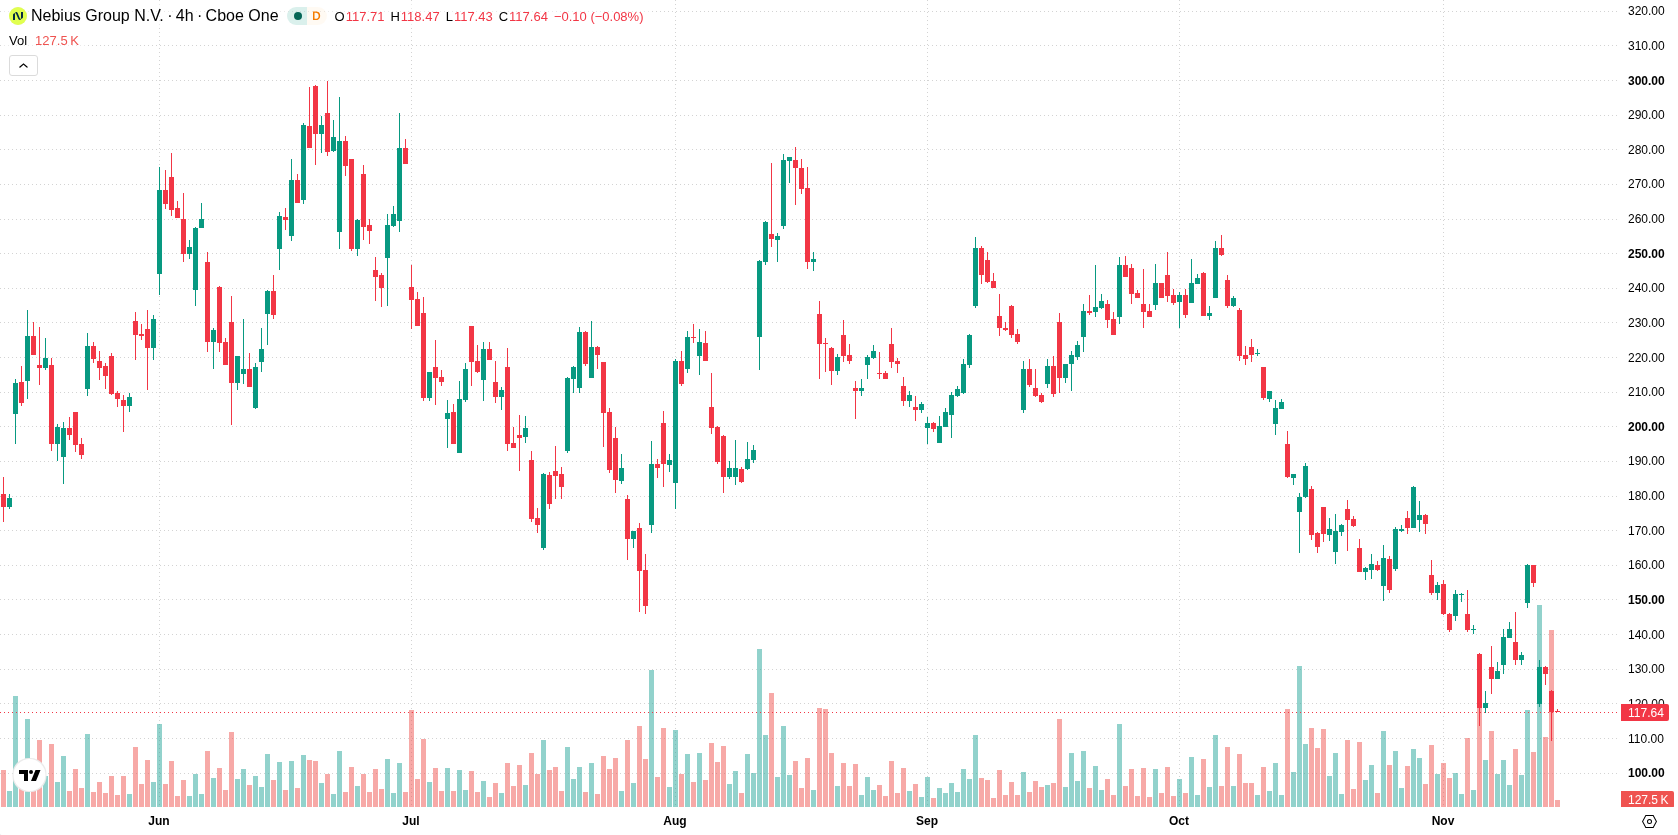
Nebius Group N.V. (NBIS) slumped 7.85% after posting strong quarterly revenue growth, even as its updated guidance delayed its $7 billion annualized run-rate goal and signaled increased capital expenditures. The accelerated downside is supported by the stock remaining well below all major moving averages, confirming heavy selling pressure.
 123.97
160.10
Highlights
- Nebius Group N.V. posted third-quarter revenue of $980.8 million, up 571% year over year on AI cloud strength.
- Adjusted earnings per share rose to $0.31, exceeding expectations, with annualized revenue run-rate target pushed to February.
- Shares of Nebius Group trade under key moving averages with bearish technical signals and a five-day expected range of $97.78 to $138.
Guidance revision and capex hike dampen sentiment despite earnings beat
Nebius Group N.V. reported third-quarter 2026 revenue of about $980.8 million, reflecting a 571% year-over-year increase driven by AI cloud operations. Adjusted earnings per share reached $0.31, surpassing analyst expectations and marking a reversal from prior quarterly losses. The company delayed its $7 billion annualized run-rate target to February, projected 2026 revenue at the low end of guidance, and raised capital expenditure forecasts for both 2026 and 2027. Customer prepayments are expected to help fund future investment, with pretax breakeven anticipated by the fourth quarter of 2027, though price action has remained under broader selling pressure.
Bearish trend entrenched as technical breakdown extends and sellers dominate
Nebius Group is trading well below its short-, medium-, and long-term moving averages, with the price at $117.89 versus the 20-day, 50-day, and 200-day levels of $153.60, $196.50, and $179.25. This configuration points to sustained pressure from sellers across all horizons, with the Ichimoku Kijun at $173.71 confirming a dominant bearish trend backdrop. Immediate levels are marked by support at $109.21 and resistance at $119.88. Momentum indicators reinforce the prevailing downward tone: MACD and Average Directional Index (ADX) both signal further selling pressure. The Relative Strength Index (RSI) and Stochastic RSI are neutral, while the Commodity Channel Index (CCI) is in the oversold zone, suggesting selling exhaustion could emerge. Bull/Bear Power (BBP) is negative, confirming sellers have intraday control. Awesome Oscillator is neutral. The stock is currently down $10.04 or 7.85%, having opened with a downside gap of about 3.38%. Price sits mid-range between $109.21 and $123.61, and intraday volatility stands at 13.19%. The session dynamic reflects steep selling pressure after the open, consistent with the overall momentum picture.
Previously it was reported that Leverage Shares plc triggered an intraday rebalance on its leveraged Nebius ETP after a sharp decline in the underlying stock. The current technical profile signals ongoing downside risk for Nebius Group, with traders advised to closely watch the $109.21 support level for signs of further deterioration.






Latest Nebius Group N.V. News




-
 Afghanistan
-
 Albania
-
 Algeria
-
 Angola
-
 Argentina
-
 Armenia
-
 Australia
-
 Austria
-
 Azerbaijan
-
 Bahamas
-
 Bahrain
-
 Bangladesh
-
 Belarus
-
 Belgium
-
 Bolivia
-
 Botswana
-
 Brazil
-
 Brunei
-
 Bulgaria
-
 Cambodia
-
 Cameroon
-
 Canada
-
 Chile
-
 China
-
 Colombia
-
 Congo
-
 Costa Rica
-
 Cote d'Ivoire
-
 Croatia
-
 Cuba
-
 Cyprus
-
 Czechia
-
 DR Congo
-
 Denmark
-
 Dominican Republic
-
 Ecuador
-
 Egypt
-
 El Salvador
-
 Estonia
-
 Eswatini
-
 Ethiopia
-
 Finland
-
 France
-
 Georgia
-
 Germany
-
 Ghana
-
 Greece
-
 Haiti
-
 Hong Kong
-
 Hungary
-
 India
-
 Indonesia
-
 Iran, Islamic republic
-
 Iraq
-
 Ireland
-
 Israel
-
 Italy
-
 Jamaica
-
 Japan
-
 Jordan
-
 Kazakhstan
-
 Kenya
-
 Korea
-
 Kuwait
-
 Kyrgyzstan
-
 Laos
-
 Latvia
-
 Lebanon
-
 Lesotho
-
 Libya
-
 Lithuania
-
 Luxembourg
-
 Madagascar
-
 Malaysia
-
 Malta
-
 Mauritius
-
 Mexico
-
 Moldova
-
 Mongolia
-
 Montenegro
-
 Morocco
-
 Mozambique
-
 Myanmar
-
 Namibia
-
 Nepal
-
 Netherlands
-
 New Zealand
-
 Nigeria
-
 North Macedonia
-
 Norway
-
 Oman
-
 Pakistan
-
 Palestine
-
 Panama
-
 Papua New Guinea
-
 Paraguay
-
 Peru
-
 Philippines
-
 Poland
-
 Portugal
-
 Puerto Rico
-
 Qatar
-
 Reunion
-
 Romania
-
 Rwanda
-
 Saudi Arabia
-
 Serbia
-
 Singapore
-
 Slovakia
-
 Slovenia
-
 Somalia
-
 South Africa
-
 Spain
-
 Sri Lanka
-
 Sweden
-
 Switzerland
-
 Syria
-
 Taiwan
-
 Tajikistan
-
 Tanzania
-
 Thailand
-
 Trinidad and Tobago
-
 Tunisia
-
 Turkey
-
 UAE
-
 Uganda
-
 Ukraine
-
 United Kingdom
-
United States
-
 Uruguay
-
 Uzbekistan
-
 Venezuela
-
 Vietnam
-
 Yemen
-
 Zambia
-
 Zimbabwe
- Forex
- Crypto












