

Strategy stock slides as weak momentum and seller pressure dominate trading

Strategy (MSTR, formerly MicroStrategy) stock is trading at $120.35 after a 4.3% decline on the day. Shares are positioned below key short- and long-term moving averages, reflecting continued downside pressure.
 126.40
145.85
Highlights
- Strategy sold 2,051,348 Class A shares for $283.8 million, expanding equity float and introducing potential supply pressure.
- $81.9 million of proceeds funded the purchase of 1,036 bitcoin, increasing digital asset exposure and balance sheet risk.
- Shares trade below key moving averages with momentum indicators negative; forecast range is $109.96 to $130.74 and further downside is likely.
Share sale and bitcoin purchase alter supply and risk dynamics
Between November 2 and November 8, 2026, Strategy conducted a sizable sale of 2,051,348 Class A common shares, generating $283.8 million in net proceeds and increasing the equity float, which can exert downward pressure as additional supply reaches the market. Of the funds raised, $81.9 million was directed toward acquiring 1,036 bitcoin, highlighting a continued focus on digital asset accumulation and additional balance sheet risk. Furthermore, $188.3 million was used to repurchase Strategy's variable-rate Series A Perpetual Stretch Preferred Stock, an action that may modestly improve the capital structure by reducing outstanding preferred obligations. The remaining $13.6 million was allocated to USD cash, according to Streetinsider, adding to liquidity reserves.
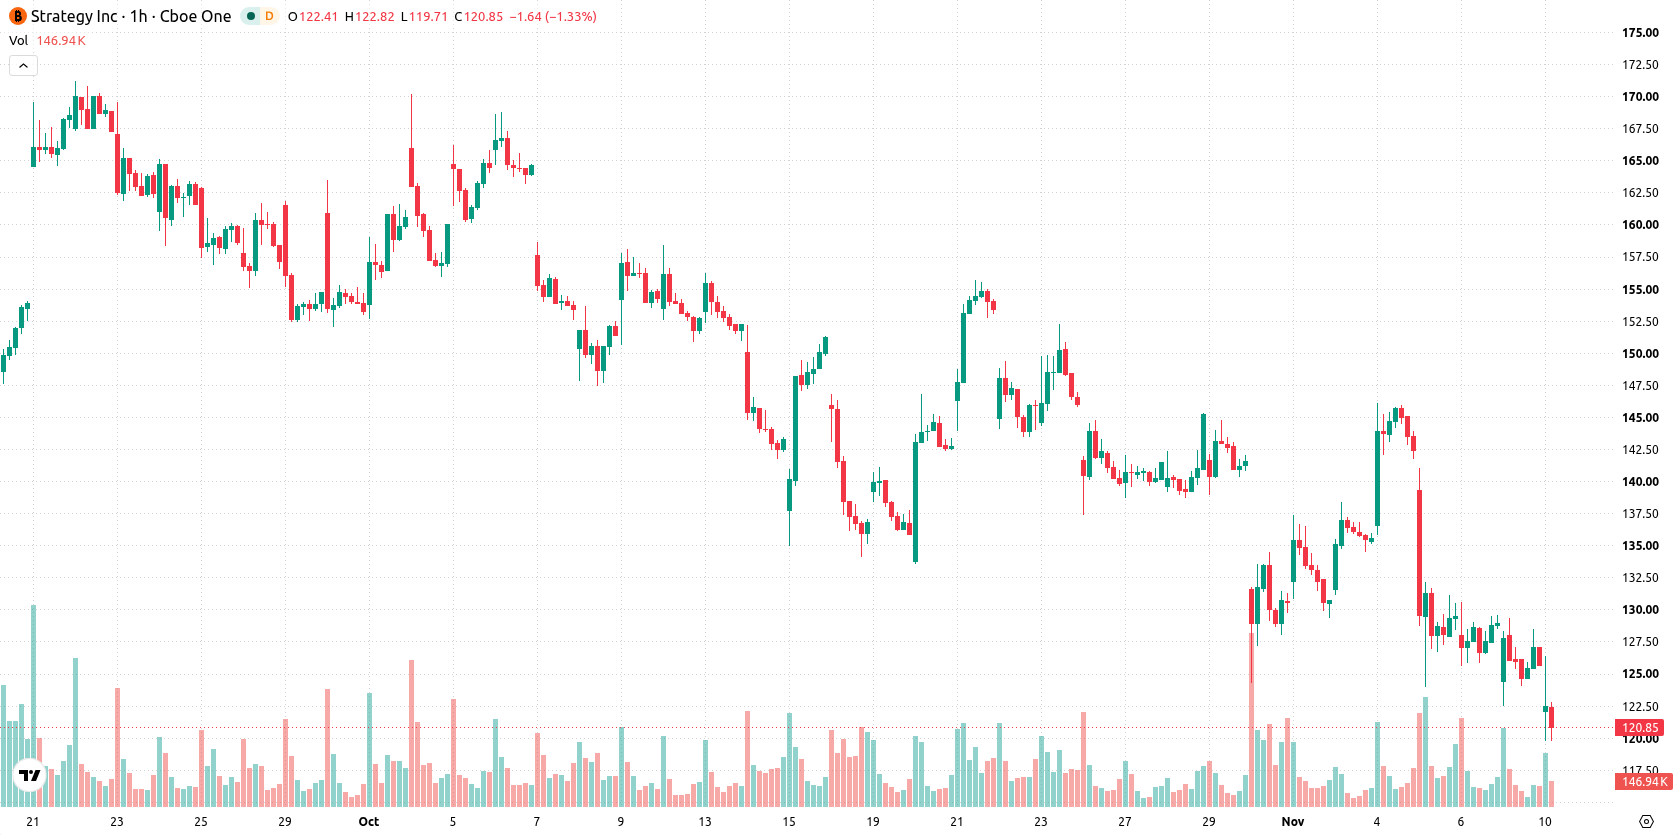
Multiple resistance levels and momentum signals sustain bearish bias
Technical analysis highlights that MSTR is trading below the MA-20, MA-50, and MA-200 on the hourly chart, indicating resistance from multiple timeframes. The Ichimoku Kijun currently stands at $134.18, acting as the immediate resistance level for any recovery attempts. Momentum indicators reinforce the bearish setup: MACD and ADX are both sending strong sell signals, while RSI, Stochastic RSI, and CCI remain neutral, not showing oversold or overbought conditions. Bull/Bear Power confirms seller dominance on the intraday timeframe, with price action hovering near session lows amid persistent high volatility.
Downside risk elevated as volatility band caps upside probability
In the short term, MSTR is likely to oscillate within a volatility band spanning $109.96 to $130.74, as momentum heavily favors further downside. An upside scenario would require the price to break decisively through immediate resistance at the Ichimoku Kijun, while a breach below the lower range boundary could open the door for continued declines. Probability assessments indicate a very low chance of upward movement, with a markedly higher risk of additional selling pressure in the coming sessions.
Previously it was reported that Strategy shares remained under sustained bearish pressure despite improvements in the company's balance sheet. This analysis is reinforced by the latest technical indicators and recent share issuance, suggesting traders should monitor volatility bands for signs of further downside or potential stabilization.










-
 Afghanistan
-
 Albania
-
 Algeria
-
 Angola
-
 Argentina
-
 Armenia
-
 Australia
-
 Austria
-
 Azerbaijan
-
 Bahamas
-
 Bahrain
-
 Bangladesh
-
 Belarus
-
 Belgium
-
 Bolivia
-
 Botswana
-
 Brazil
-
 Brunei
-
 Bulgaria
-
 Cambodia
-
 Cameroon
-
 Canada
-
 Chile
-
 China
-
 Colombia
-
 Congo
-
 Costa Rica
-
 Cote d'Ivoire
-
 Croatia
-
 Cuba
-
 Cyprus
-
 Czechia
-
 DR Congo
-
 Denmark
-
 Dominican Republic
-
 Ecuador
-
 Egypt
-
 El Salvador
-
 Estonia
-
 Eswatini
-
 Ethiopia
-
 Finland
-
 France
-
 Georgia
-
 Germany
-
 Ghana
-
 Greece
-
 Haiti
-
 Hong Kong
-
 Hungary
-
 India
-
 Indonesia
-
 Iran, Islamic republic
-
 Iraq
-
 Ireland
-
 Israel
-
 Italy
-
 Jamaica
-
 Japan
-
 Jordan
-
 Kazakhstan
-
 Kenya
-
 Korea
-
 Kuwait
-
 Kyrgyzstan
-
 Laos
-
 Latvia
-
 Lebanon
-
 Lesotho
-
 Libya
-
 Lithuania
-
 Luxembourg
-
 Madagascar
-
 Malaysia
-
 Malta
-
 Mauritius
-
 Mexico
-
 Moldova
-
 Mongolia
-
 Montenegro
-
 Morocco
-
 Mozambique
-
 Myanmar
-
 Namibia
-
 Nepal
-
 Netherlands
-
 New Zealand
-
 Nigeria
-
 North Macedonia
-
 Norway
-
 Oman
-
 Pakistan
-
 Palestine
-
 Panama
-
 Papua New Guinea
-
 Paraguay
-
 Peru
-
 Philippines
-
 Poland
-
 Portugal
-
 Puerto Rico
-
 Qatar
-
 Reunion
-
 Romania
-
 Rwanda
-
 Saudi Arabia
-
 Serbia
-
 Singapore
-
 Slovakia
-
 Slovenia
-
 Somalia
-
 South Africa
-
 Spain
-
 Sri Lanka
-
 Sweden
-
 Switzerland
-
 Syria
-
 Taiwan
-
 Tajikistan
-
 Tanzania
-
 Thailand
-
 Trinidad and Tobago
-
 Tunisia
-
 Turkey
-
 UAE
-
 Uganda
-
 Ukraine
-
 United Kingdom
-
United States
-
 Uruguay
-
 Uzbekistan
-
 Venezuela
-
 Vietnam
-
 Yemen
-
 Zambia
-
 Zimbabwe
- Forex
- Crypto












