

Rivian shares technical analysis: Support at $13.46 in focus as downside momentum builds

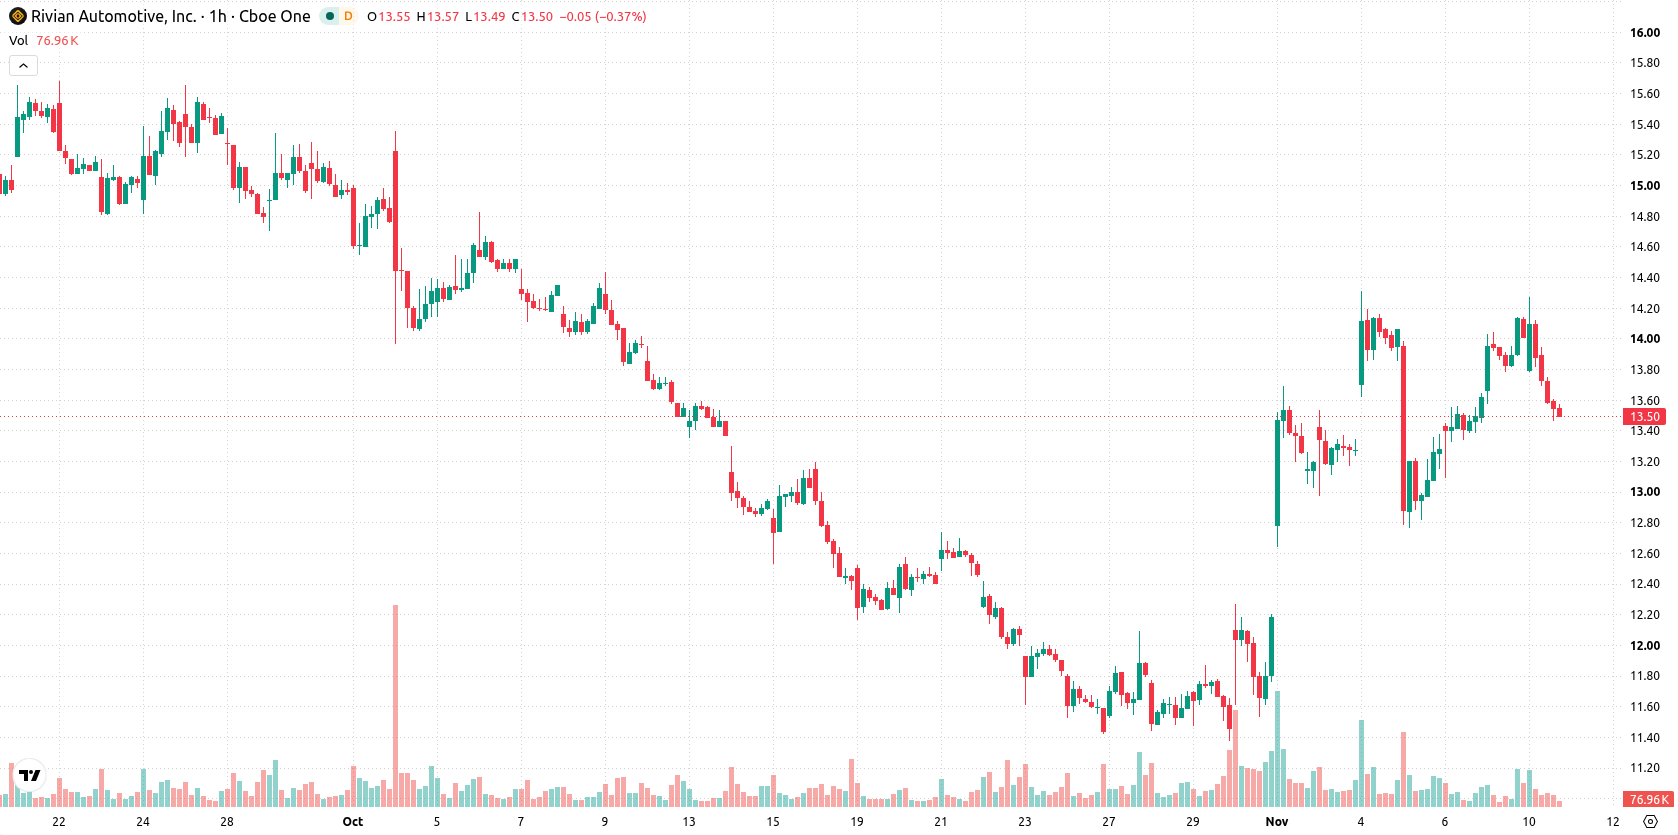
Rivian (RIVN) stock is trading at $13.50, down 3.64% on the day and closing near the session low. The price sits below its key short-term moving averages but remains above certain medium-term trend lines, highlighting a complex technical picture amid elevated intraday volatility.
 12.80
14.25
Highlights
- Rivian reported third-quarter revenue of $2.16 billion and 19,248 vehicle deliveries, both above consensus expectations.
- The company raised its 2026 vehicle delivery outlook and announced improved production efficiency, with operating losses coming in narrower than forecast.
- Shares of Rivian remain under long-term bearish pressure as technical signals are mixed, with a short-term expected consolidation range of $12.83 to $14.17 and a 55% probability of an upward move.
Operating gains and guidance upgrade support outlook amid selling pressure
Rivian reported third-quarter revenue of $2.16 billion and deliveries of 19,248 vehicles, both exceeding consensus expectations, as noted by Investing.com. The company also improved its fiscal 2026 outlook by raising vehicle delivery guidance and reporting narrower-than-forecast operating losses, reflecting advances in production efficiency and financial management. Additionally, upcoming software updates are set to introduce new features to R1 and R2 vehicles later this month, according to Notateslaapp, while an expanded partnership with Redwood Materials focuses on battery recycling and storage infrastructure at Rivian’s Illinois plant, as reported by Batteriesnews. These developments collectively highlight operational and strategic progress, though price action has remained under broader selling pressure.
Bullish momentum emerges as technical signals and boundaries diverge
On the hourly chart, RIVN is trading below the MA-20 at $13.53 and above the MA-50 at $13.26, while on the daily timeframe, it remains under the long-term MA-200 at $15.38. The Ichimoku Kijun support is established at $13.46. Both MACD and ADX have generated buy signals, indicating bullish momentum within the session, while RSI and Stochastic RSI show neutral conditions. CCI is in overbought territory, suggesting correction risk, and Bull/Bear Power stands slightly positive at 0.36, with the Awesome Oscillator reading neutral.
Upside tilt for Rivian held in check by consolidation risk
In the coming days, the anticipated price range for RIVN is $12.83 to $14.17, reflecting a typical volatility band relative to current levels. There is a 55% probability of an upward move against a 45% chance of a decline. The base scenario points to continued consolidation within this band, while a sustained break above resistance could open the way for further gains. Conversely, loss of support would likely drive prices toward the lower edge of the expected range.
Previously it was reported that Rivian has been investing heavily in 3D printing technologies to enhance its production processes, improve efficiency, and reduce costs throughout its manufacturing operations. The current technical setup underscores a period of price consolidation, with the key level to watch being $13.46 as it serves as both Ichimoku Kijun support and a potential pivot point for near-term price direction.






Latest Rivian Automotive News





-
 Afghanistan
-
 Albania
-
 Algeria
-
 Angola
-
 Argentina
-
 Armenia
-
 Australia
-
 Austria
-
 Azerbaijan
-
 Bahamas
-
 Bahrain
-
 Bangladesh
-
 Belarus
-
 Belgium
-
 Bolivia
-
 Botswana
-
 Brazil
-
 Brunei
-
 Bulgaria
-
 Cambodia
-
 Cameroon
-
 Canada
-
 Chile
-
 China
-
 Colombia
-
 Congo
-
 Costa Rica
-
 Cote d'Ivoire
-
 Croatia
-
 Cuba
-
 Cyprus
-
 Czechia
-
 DR Congo
-
 Denmark
-
 Dominican Republic
-
 Ecuador
-
 Egypt
-
 El Salvador
-
 Estonia
-
 Eswatini
-
 Ethiopia
-
 Finland
-
 France
-
 Georgia
-
 Germany
-
 Ghana
-
 Greece
-
 Haiti
-
 Hong Kong
-
 Hungary
-
 India
-
 Indonesia
-
 Iran, Islamic republic
-
 Iraq
-
 Ireland
-
 Israel
-
 Italy
-
 Jamaica
-
 Japan
-
 Jordan
-
 Kazakhstan
-
 Kenya
-
 Korea
-
 Kuwait
-
 Kyrgyzstan
-
 Laos
-
 Latvia
-
 Lebanon
-
 Lesotho
-
 Libya
-
 Lithuania
-
 Luxembourg
-
 Madagascar
-
 Malaysia
-
 Malta
-
 Mauritius
-
 Mexico
-
 Moldova
-
 Mongolia
-
 Montenegro
-
 Morocco
-
 Mozambique
-
 Myanmar
-
 Namibia
-
 Nepal
-
 Netherlands
-
 New Zealand
-
 Nigeria
-
 North Macedonia
-
 Norway
-
 Oman
-
 Pakistan
-
 Palestine
-
 Panama
-
 Papua New Guinea
-
 Paraguay
-
 Peru
-
 Philippines
-
 Poland
-
 Portugal
-
 Puerto Rico
-
 Qatar
-
 Reunion
-
 Romania
-
 Rwanda
-
 Saudi Arabia
-
 Serbia
-
 Singapore
-
 Slovakia
-
 Slovenia
-
 Somalia
-
 South Africa
-
 Spain
-
 Sri Lanka
-
 Sweden
-
 Switzerland
-
 Syria
-
 Taiwan
-
 Tajikistan
-
 Tanzania
-
 Thailand
-
 Trinidad and Tobago
-
 Tunisia
-
 Turkey
-
 UAE
-
 Uganda
-
 Ukraine
-
 United Kingdom
-
United States
-
 Uruguay
-
 Uzbekistan
-
 Venezuela
-
 Vietnam
-
 Yemen
-
 Zambia
-
 Zimbabwe
- Forex
- Crypto












