

RIVN declines as downward momentum remains strong and oversold signals appear

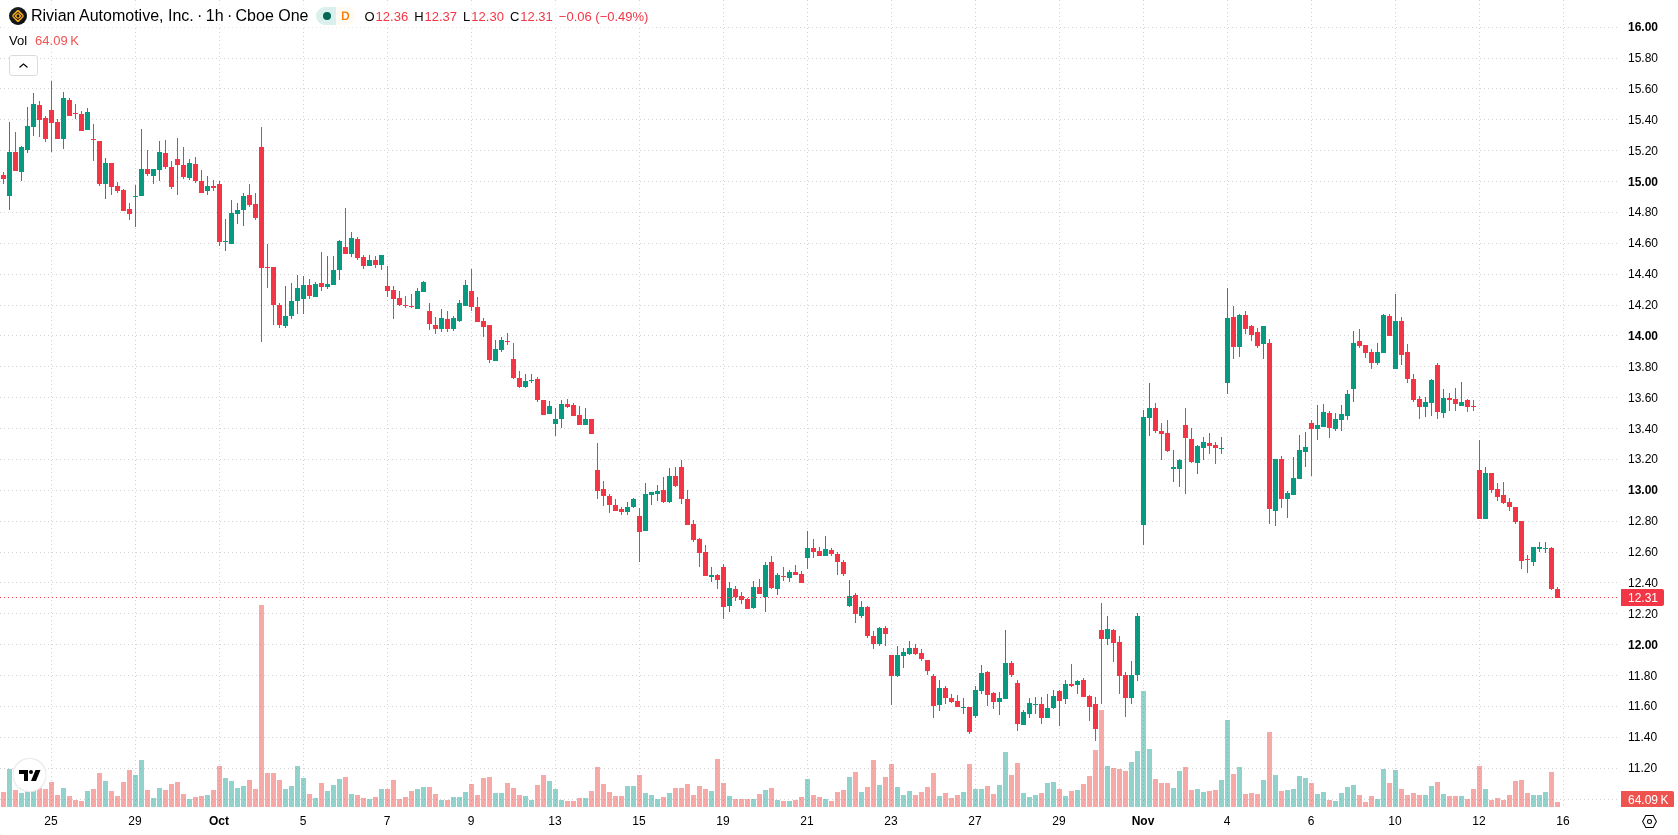
Rivian (RIVN) stock is trading at $12.21, marking a daily decline of 4.61%. The price is positioned below its key moving averages, indicating notable weakness against recent trend benchmarks.
 12.80
14.25
Highlights
- Rivian Automotive delivered 19,248 vehicles in the third quarter and reported $2.16 billion in revenue, surpassing consensus expectations.
- Management raised 2026 delivery guidance midpoint to 67,000 to 70,000 vehicles, and a software update introducing enhanced navigation is planned.
- Shares of Rivian closed at $12.21, down 4.61%, trading below key moving averages with technical signals confirming a bearish trend and support expected between $11.55 and $12.87.
Upbeat delivery guidance and new features trumped by ongoing selling pressure
Rivian Automotive Inc. reported third-quarter revenue of $2.16 billion, exceeding consensus forecasts, with 19,248 vehicles delivered during the period, according to Investing.com. This operational outperformance indicates solid execution and sustained demand in the company’s core business lines. Rivian also raised its fiscal 2026 delivery guidance midpoint to a range of 67,000–70,000 vehicles, reflecting a more constructive management outlook for medium-term production scaling. Additionally, an upcoming 2026.41 software update will introduce new navigation features and enhanced usability for owners, as reported by Riviantrackr, though price action has remained under broader selling pressure.
Momentum deteriorates as price slips beneath key technical levels
RIVN is trading below the MA-20 at $13.31 and the MA-50 at $13.52 on the hourly chart, as well as below the MA-200 at $15.35 on the daily timeframe. The Ichimoku Kijun is providing immediate resistance at $13.42. Momentum indicators present a bearish picture: MACD and ADX both signal a sell bias, while the RSI, Stoch RSI, and CCI are all in oversold territory. Bull/Bear Power is negative at -0.27, emphasizing seller dominance, and the Awesome Oscillator continues to point to negative momentum. Session volatility is subdued, with the price closing near the day's low.
Downside favored as price stabilizes within narrow volatility band
Over the next several days, RIVN is expected to consolidate within a trading range of $11.55 to $12.87. The probability of an upward move is 21%, while the chance of continued decline stands at 79%. The baseline scenario anticipates price stabilization within this band; however, a break above immediate resistance could trigger a bullish reversal, while a breach below the lower bound would reinforce further downside. These scenarios reflect the current volatility band relative to recent trend benchmarks.
Earlier, analysts noted that Rivian shares were experiencing persistent selling pressure despite operational progress, with a higher probability assigned to further downside risk. The current analysis reinforces this outlook, as continued weakness below critical moving averages and ongoing oversold technical readings highlight the importance of monitoring the $11.55 support for potential breakdowns in the near term.






Latest Rivian Automotive News





-
 Afghanistan
-
 Albania
-
 Algeria
-
 Angola
-
 Argentina
-
 Armenia
-
 Australia
-
 Austria
-
 Azerbaijan
-
 Bahamas
-
 Bahrain
-
 Bangladesh
-
 Belarus
-
 Belgium
-
 Bolivia
-
 Botswana
-
 Brazil
-
 Brunei
-
 Bulgaria
-
 Cambodia
-
 Cameroon
-
 Canada
-
 Chile
-
 China
-
 Colombia
-
 Congo
-
 Costa Rica
-
 Cote d'Ivoire
-
 Croatia
-
 Cuba
-
 Cyprus
-
 Czechia
-
 DR Congo
-
 Denmark
-
 Dominican Republic
-
 Ecuador
-
 Egypt
-
 El Salvador
-
 Estonia
-
 Eswatini
-
 Ethiopia
-
 Finland
-
 France
-
 Georgia
-
 Germany
-
 Ghana
-
 Greece
-
 Haiti
-
 Hong Kong
-
 Hungary
-
 India
-
 Indonesia
-
 Iran, Islamic republic
-
 Iraq
-
 Ireland
-
 Israel
-
 Italy
-
 Jamaica
-
 Japan
-
 Jordan
-
 Kazakhstan
-
 Kenya
-
 Korea
-
 Kuwait
-
 Kyrgyzstan
-
 Laos
-
 Latvia
-
 Lebanon
-
 Lesotho
-
 Libya
-
 Lithuania
-
 Luxembourg
-
 Madagascar
-
 Malaysia
-
 Malta
-
 Mauritius
-
 Mexico
-
 Moldova
-
 Mongolia
-
 Montenegro
-
 Morocco
-
 Mozambique
-
 Myanmar
-
 Namibia
-
 Nepal
-
 Netherlands
-
 New Zealand
-
 Nigeria
-
 North Macedonia
-
 Norway
-
 Oman
-
 Pakistan
-
 Palestine
-
 Panama
-
 Papua New Guinea
-
 Paraguay
-
 Peru
-
 Philippines
-
 Poland
-
 Portugal
-
 Puerto Rico
-
 Qatar
-
 Reunion
-
 Romania
-
 Rwanda
-
 Saudi Arabia
-
 Serbia
-
 Singapore
-
 Slovakia
-
 Slovenia
-
 Somalia
-
 South Africa
-
 Spain
-
 Sri Lanka
-
 Sweden
-
 Switzerland
-
 Syria
-
 Taiwan
-
 Tajikistan
-
 Tanzania
-
 Thailand
-
 Trinidad and Tobago
-
 Tunisia
-
 Turkey
-
 UAE
-
 Uganda
-
 Ukraine
-
 United Kingdom
-
United States
-
 Uruguay
-
 Uzbekistan
-
 Venezuela
-
 Vietnam
-
 Yemen
-
 Zambia
-
 Zimbabwe
- Forex
- Crypto












