

STLD rises as upward price momentum attracts buyers

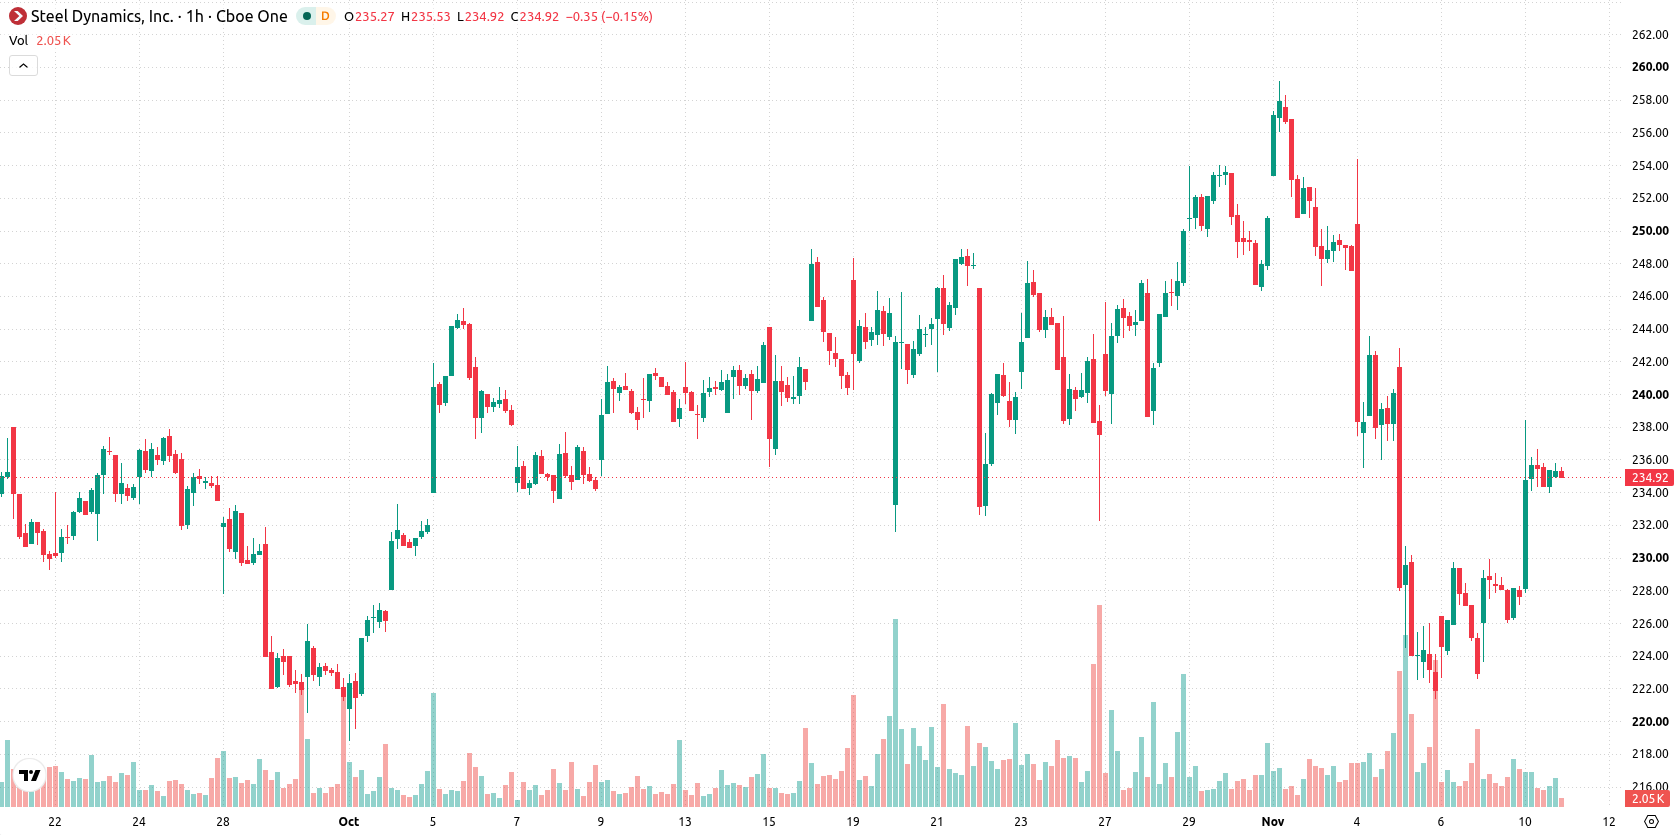
Steel Dynamics (STLD) stock is trading at $235.19, up 3.31% on the day. The price sits above its key short-term and long-term moving averages, while encountering resistance from medium-term trends.
 239.68
241.61
Highlights
- Steel Dynamics authorized a $3 billion share repurchase program that expands buybacks and supports per-share value growth.
- The company declared a quarterly dividend of $0.53 per share, with payment scheduled at the end of 2026 for long-term yield.
- Shares gained 3.31% to $235.19 amid mixed technicals, with downside risk prevailing in a $222.27 to $248.11 range over 2 to 3 days.
Buyback expansion and dividend promise boost shareholder returns outlook
Steel Dynamics has authorized an additional $3 billion share repurchase program, which immediately expands its capital allocation toward reducing share count and directly supports per-share performance, according to PR Newswire. This sizeable buyback signals management’s commitment to shareholder returns and delivers a tangible source of demand for the stock on the open market. In addition, the company declared a quarterly cash dividend of $0.53 per share, payable at the end of 2026, offering long-term income potential that may attract institutional and retail investors. Together, these actions reflect a robust capital return strategy that aligns with recent upward price momentum.
Mixed momentum signals as technical support contrasts with overbought risk
STLD/USD is trading above the MA-20 and MA-200, while still below the MA-50, highlighting short-term and long-term supportive trends but indicating medium-term resistance. The Ichimoku Kijun level at $232.08 is acting as immediate support. MACD reveals strong sell momentum, whereas ADX points to ongoing buying interest. RSI is neutral, but both Stoch RSI and CCI are in overbought territory, pointing to risk of short-term overheating. Bull/Bear Power remains positive, emphasizing strong intraday buying, while the Awesome Oscillator is inconclusive for additional trend direction.
Sideways pattern likely as volatility bands frame risk of breakout
Over the next two to three trading days, STLD is expected to trade within the $222.27–$248.11 band, reflecting the typical volatility range. There is a marginally higher probability (55%) of a downside move versus a 45% chance of further upside. The baseline scenario projects continued sideways movement within this corridor, while a clear break above resistance could open a move toward the upper boundary or, conversely, a fall below support risks a pullback to recent lows.
In a recent review, analysts noted that Steel Dynamics was contending with significant short-term selling pressure despite maintaining longer-term technical support. The present conditions, featuring a robust share buyback announcement and upward momentum above key moving averages, introduce fresh catalysts for price action, making the ability to sustain current levels relative to medium-term resistance critical for near-term direction.










-
 Afghanistan
-
 Albania
-
 Algeria
-
 Angola
-
 Argentina
-
 Armenia
-
 Australia
-
 Austria
-
 Azerbaijan
-
 Bahamas
-
 Bahrain
-
 Bangladesh
-
 Belarus
-
 Belgium
-
 Bolivia
-
 Botswana
-
 Brazil
-
 Brunei
-
 Bulgaria
-
 Cambodia
-
 Cameroon
-
 Canada
-
 Chile
-
 China
-
 Colombia
-
 Congo
-
 Costa Rica
-
 Cote d'Ivoire
-
 Croatia
-
 Cuba
-
 Cyprus
-
 Czechia
-
 DR Congo
-
 Denmark
-
 Dominican Republic
-
 Ecuador
-
 Egypt
-
 El Salvador
-
 Estonia
-
 Eswatini
-
 Ethiopia
-
 Finland
-
 France
-
 Georgia
-
 Germany
-
 Ghana
-
 Greece
-
 Haiti
-
 Hong Kong
-
 Hungary
-
 India
-
 Indonesia
-
 Iran, Islamic republic
-
 Iraq
-
 Ireland
-
 Israel
-
 Italy
-
 Jamaica
-
 Japan
-
 Jordan
-
 Kazakhstan
-
 Kenya
-
 Korea
-
 Kuwait
-
 Kyrgyzstan
-
 Laos
-
 Latvia
-
 Lebanon
-
 Lesotho
-
 Libya
-
 Lithuania
-
 Luxembourg
-
 Madagascar
-
 Malaysia
-
 Malta
-
 Mauritius
-
 Mexico
-
 Moldova
-
 Mongolia
-
 Montenegro
-
 Morocco
-
 Mozambique
-
 Myanmar
-
 Namibia
-
 Nepal
-
 Netherlands
-
 New Zealand
-
 Nigeria
-
 North Macedonia
-
 Norway
-
 Oman
-
 Pakistan
-
 Palestine
-
 Panama
-
 Papua New Guinea
-
 Paraguay
-
 Peru
-
 Philippines
-
 Poland
-
 Portugal
-
 Puerto Rico
-
 Qatar
-
 Reunion
-
 Romania
-
 Rwanda
-
 Saudi Arabia
-
 Serbia
-
 Singapore
-
 Slovakia
-
 Slovenia
-
 Somalia
-
 South Africa
-
 Spain
-
 Sri Lanka
-
 Sweden
-
 Switzerland
-
 Syria
-
 Taiwan
-
 Tajikistan
-
 Tanzania
-
 Thailand
-
 Trinidad and Tobago
-
 Tunisia
-
 Turkey
-
 UAE
-
 Uganda
-
 Ukraine
-
 United Kingdom
-
United States
-
 Uruguay
-
 Uzbekistan
-
 Venezuela
-
 Vietnam
-
 Yemen
-
 Zambia
-
 Zimbabwe
- Forex
- Crypto












