

AbbVie shares weekly forecast: Overbought CCI reading highlights correction risk as momentum holds

Shares of AbbVie Inc. (ABBV) are trading near $294 as the recovery setup remains in place, though momentum now appears stretched after a modest week. Corporate drivers are still in focus as recent gains hold. This week, attention turns to whether the uptrend can persist or if a pause emerges from overbought conditions.
 297.25
300.42
Highlights
- AbbVie stock trades at $293.89, holding above key short-term trend levels with strong upward momentum.
- Technical readings show a bullish trend, though overbought conditions introduce the potential for a short-term pullback.
- The expected trading range is $284.62 to $304.62, with $288.04 as key support and $302.68 as resistance.
Earnings strength and pipeline deals reinforce sentiment as outlook improves
AbbVie reported strong third quarter 2026 results, including net revenue of approximately $17.4 billion and a raised full-year earnings outlook along with a 5.2% dividend increase, according to Yahoo Finance. The company’s strengths in immunology and neuroscience were reinforced by robust sales of key products. Additional news included positive Phase 4 trial data in Allergan Aesthetics and the announcement of a global licensing deal with Nxera Pharma to expand the immunology pipeline.
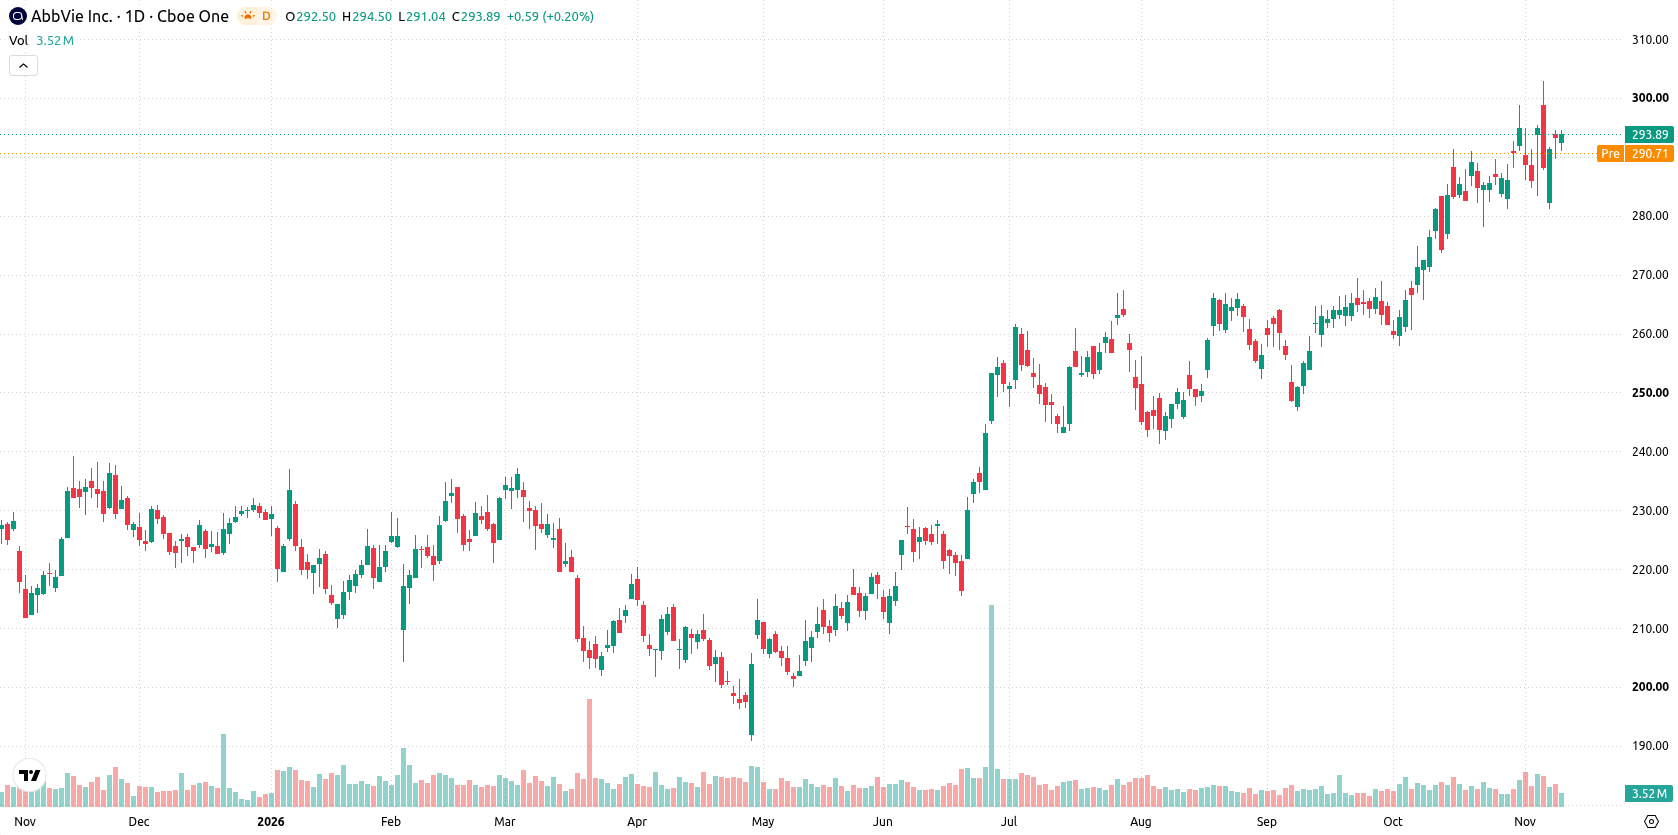
Bullish momentum persists this week even as oscillators warn of correction
The daily chart shows a sustained move higher with a firm trend, underscored by a bullish MACD reading of 6.48 and a constructive ADX. CCI's overbought status at 110.18 points to some possible correction risk, but overall oscillator signals are mostly neutral. The nearest support sits at the 20-day moving average of $288.04, with resistance at the recent weekly high of $302.68. Volatility has registered at 7.35%, indicative of an active trading environment.
Bullish bias prevails next week as breakout and support levels guide range
In the week ahead, AbbVie shares are expected to trade in the $284.62 to $304.62 range, with a very high probability of an increase and a very low probability of a decrease. The base case is for continued strength within this range, anchored by strong momentum. A break above $302.68 could open the way for further gains, given current trend signals. However, a drop below $288.04 would place focus on the Ichimoku Kijun support at $281.78 as the next key downside level.
Earlier, analysts noted that AbbVie’s technical setup suggested a constructive trend with the potential for further gains, though a possible near-term inflection point was highlighted. Current price action and indicator readings confirm continued strength, but with overbought signals emerging, traders should closely watch the $302.68 resistance for signs of either an extended breakout or the start of a corrective pullback.











-
 Afghanistan
-
 Albania
-
 Algeria
-
 Angola
-
 Argentina
-
 Armenia
-
 Australia
-
 Austria
-
 Azerbaijan
-
 Bahamas
-
 Bahrain
-
 Bangladesh
-
 Belarus
-
 Belgium
-
 Bolivia
-
 Botswana
-
 Brazil
-
 Brunei
-
 Bulgaria
-
 Cambodia
-
 Cameroon
-
 Canada
-
 Chile
-
 China
-
 Colombia
-
 Congo
-
 Costa Rica
-
 Cote d'Ivoire
-
 Croatia
-
 Cuba
-
 Cyprus
-
 Czechia
-
 DR Congo
-
 Denmark
-
 Dominican Republic
-
 Ecuador
-
 Egypt
-
 El Salvador
-
 Estonia
-
 Eswatini
-
 Ethiopia
-
 Finland
-
 France
-
 Georgia
-
 Germany
-
 Ghana
-
 Greece
-
 Haiti
-
 Hong Kong
-
 Hungary
-
 India
-
 Indonesia
-
 Iran, Islamic republic
-
 Iraq
-
 Ireland
-
 Israel
-
 Italy
-
 Jamaica
-
 Japan
-
 Jordan
-
 Kazakhstan
-
 Kenya
-
 Korea
-
 Kuwait
-
 Kyrgyzstan
-
 Laos
-
 Latvia
-
 Lebanon
-
 Lesotho
-
 Libya
-
 Lithuania
-
 Luxembourg
-
 Madagascar
-
 Malaysia
-
 Malta
-
 Mauritius
-
 Mexico
-
 Moldova
-
 Mongolia
-
 Montenegro
-
 Morocco
-
 Mozambique
-
 Myanmar
-
 Namibia
-
 Nepal
-
 Netherlands
-
 New Zealand
-
 Nigeria
-
 North Macedonia
-
 Norway
-
 Oman
-
 Pakistan
-
 Palestine
-
 Panama
-
 Papua New Guinea
-
 Paraguay
-
 Peru
-
 Philippines
-
 Poland
-
 Portugal
-
 Puerto Rico
-
 Qatar
-
 Reunion
-
 Romania
-
 Rwanda
-
 Saudi Arabia
-
 Serbia
-
 Singapore
-
 Slovakia
-
 Slovenia
-
 Somalia
-
 South Africa
-
 Spain
-
 Sri Lanka
-
 Sweden
-
 Switzerland
-
 Syria
-
 Taiwan
-
 Tajikistan
-
 Tanzania
-
 Thailand
-
 Trinidad and Tobago
-
 Tunisia
-
 Turkey
-
 UAE
-
 Uganda
-
 Ukraine
-
 United Kingdom
-
United States
-
 Uruguay
-
 Uzbekistan
-
 Venezuela
-
 Vietnam
-
 Yemen
-
 Zambia
-
 Zimbabwe
- Forex
- Crypto












