

Microsoft urges administration on China tech ban: MSFT remains under pressure

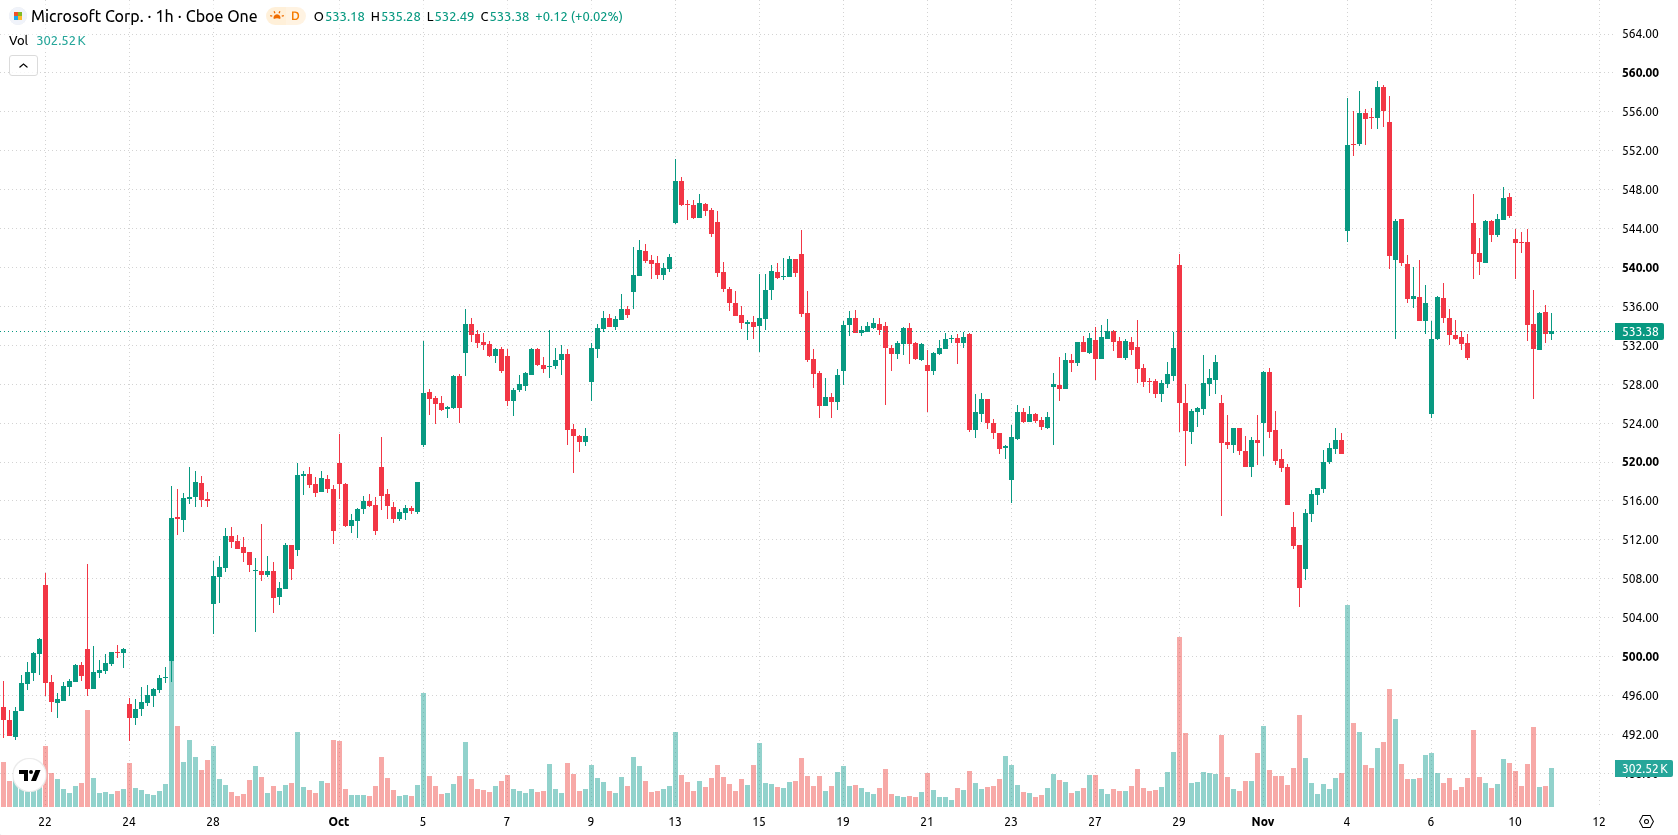
Microsoft (MSFT) stock is trading at $535.04, down 1.86% for the day. The price sits below its key short- and medium-term moving averages, while holding above the longer-term trend indicator.
 526.42
548.27
Highlights
- Anthropic released new AI-driven office applications that compete directly with Microsoft 365 in productivity software.
- Microsoft warned the Trump Administration that restrictions on Chinese optical transceivers could disrupt U.S. AI data center growth.
- Microsoft stock trades below short- and medium-term averages, showing seller pressure, with an expected range of $520.47 to $549.61.
Competitive pressures intensify as AI rivals and policy risks mount
Anthropic's introduction of new AI-powered office tools, including spreadsheet and videoconferencing software, has heightened direct competition in Microsoft's core productivity suite segment and challenged potential demand for Microsoft 365, according to TradingKey. Microsoft has also urged the Trump Administration to reconsider a proposed ban on Chinese optical transceivers, highlighting the risk of disrupted AI data center expansion in the U.S., as reported by Seeking Alpha. Additional context includes recent partnerships, such as a five-year collaboration with The Ohio State University in cloud services and AI, and the launch of Imagine Enterprise with IBM to enhance enterprise AI capabilities.
Bearish momentum persists as neutral oscillators meet strong resistance
Technically, MSFT/USD trades below its MA-20 and MA-50 on the hourly chart, reflecting continued selling pressure in short- and medium-term horizons, while staying above the MA-200 and preserving its larger bullish structure. The Ichimoku Kijun level at $536.44 acts as immediate resistance for intraday rebounds. Momentum is mixed: MACD signals neutrality, while ADX indicates a sell bias and the Awesome Oscillator also supports selling. Key oscillators, including RSI, Stochastic RSI, and CCI, all show neutral readings, confirming the absence of extremes. Bull/Bear Power registers a negative value, highlighting seller dominance within the session. Price action is within the day's middle range amid elevated volatility, and a divergence is visible as oscillator conditions remain neutral despite ongoing bearish momentum indicators.
Range-bound outlook holds as volatility drives equal breakout risk
Looking ahead, MSFT/USD is likely to consolidate within the expected short-term volatility band of $520.47–$549.61. With equal probabilities of a move in either direction, the base case calls for continued range-bound action. A sustained break above $536.44 and the upper end of the forecasted range could trigger a momentum shift in favor of buyers. Conversely, a breakdown below $520.47 would open scope for further declines and increased downside momentum.
Earlier, analysts noted that Microsoft's share price displayed resilience above key moving averages while the company maintained a stable technical outlook amid evolving catalyst dynamics. The current article introduces fresh competitive pressures in Microsoft's core business and heightened policy risks, indicating traders should monitor the $536.44 resistance level for signs of a potential momentum reversal in the short term.






Latest Microsoft News




-
 Afghanistan
-
 Albania
-
 Algeria
-
 Angola
-
 Argentina
-
 Armenia
-
 Australia
-
 Austria
-
 Azerbaijan
-
 Bahamas
-
 Bahrain
-
 Bangladesh
-
 Belarus
-
 Belgium
-
 Bolivia
-
 Botswana
-
 Brazil
-
 Brunei
-
 Bulgaria
-
 Cambodia
-
 Cameroon
-
 Canada
-
 Chile
-
 China
-
 Colombia
-
 Congo
-
 Costa Rica
-
 Cote d'Ivoire
-
 Croatia
-
 Cuba
-
 Cyprus
-
 Czechia
-
 DR Congo
-
 Denmark
-
 Dominican Republic
-
 Ecuador
-
 Egypt
-
 El Salvador
-
 Estonia
-
 Eswatini
-
 Ethiopia
-
 Finland
-
 France
-
 Georgia
-
 Germany
-
 Ghana
-
 Greece
-
 Haiti
-
 Hong Kong
-
 Hungary
-
 India
-
 Indonesia
-
 Iran, Islamic republic
-
 Iraq
-
 Ireland
-
 Israel
-
 Italy
-
 Jamaica
-
 Japan
-
 Jordan
-
 Kazakhstan
-
 Kenya
-
 Korea
-
 Kuwait
-
 Kyrgyzstan
-
 Laos
-
 Latvia
-
 Lebanon
-
 Lesotho
-
 Libya
-
 Lithuania
-
 Luxembourg
-
 Madagascar
-
 Malaysia
-
 Malta
-
 Mauritius
-
 Mexico
-
 Moldova
-
 Mongolia
-
 Montenegro
-
 Morocco
-
 Mozambique
-
 Myanmar
-
 Namibia
-
 Nepal
-
 Netherlands
-
 New Zealand
-
 Nigeria
-
 North Macedonia
-
 Norway
-
 Oman
-
 Pakistan
-
 Palestine
-
 Panama
-
 Papua New Guinea
-
 Paraguay
-
 Peru
-
 Philippines
-
 Poland
-
 Portugal
-
 Puerto Rico
-
 Qatar
-
 Reunion
-
 Romania
-
 Rwanda
-
 Saudi Arabia
-
 Serbia
-
 Singapore
-
 Slovakia
-
 Slovenia
-
 Somalia
-
 South Africa
-
 Spain
-
 Sri Lanka
-
 Sweden
-
 Switzerland
-
 Syria
-
 Taiwan
-
 Tajikistan
-
 Tanzania
-
 Thailand
-
 Trinidad and Tobago
-
 Tunisia
-
 Turkey
-
 UAE
-
 Uganda
-
 Ukraine
-
 United Kingdom
-
United States
-
 Uruguay
-
 Uzbekistan
-
 Venezuela
-
 Vietnam
-
 Yemen
-
 Zambia
-
 Zimbabwe
- Forex
- Crypto












